Following on from the last few blog posts, a third technique for estimating aboveground carbon stocks is through remote sensing. Remote sensing has relevance for my project since we are using it to identify cocoa farm typologies at a large (national) scale and I will indirectly use it to classify the carbon stock of those typologies.
Remote sensing and satellite imagery techniques can cover large ages and can be used for landscape classification when combined with secondary spatial information. Broad forest types at the landscape level and even tree dimensions at the plot level can be estimated which can then be converted into biomass using statistical relationships (Brown, 1997; Chave et al., 2005; Saatchi et al., 2011). Remote sensing techniques can broadly be grouped into categories of optical sensing, high-resolution satellite imagery, microwave or radar, and LiDAR.
Optical remote sensing data is available on a number of platforms such as Landsat, AVHRR, MODIS (Kumar and Mutanga, 2017). Different types of vegetation can be characterised by their electromagnetic reflective characteristics known as vegetation indices. Attempts have been made to relate vegetation indices to aboveground biomass with satisfactory results, see Figure 3 below which is an extract from (Clerici et al., 2016).
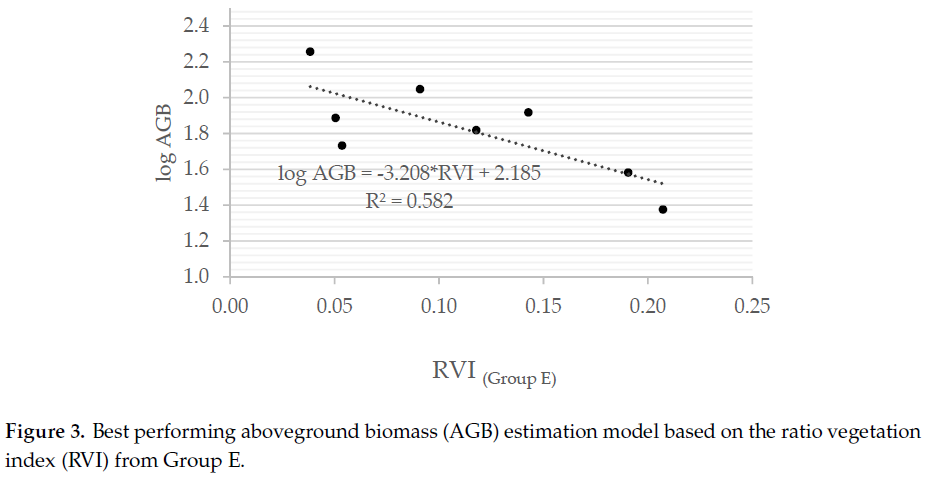
Example of a relationship between aboveground biomass (AGB) and ratio vegetation index (RVI), extracted from (Clerici et al., 2016).
High resolution satellite imagery optical images can collect tree height and crown area, which then be used in allometric equations (Gibbs et al., 2007). High resolution imagery also has applications for monitoring ecosystems, reforestation, and forest cover change (Clerici et al., 2016).
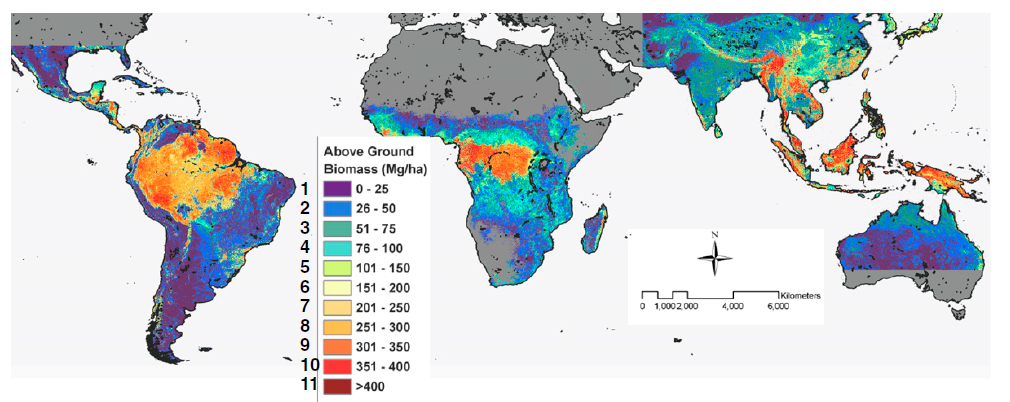
Another form of remote sensing are radar and microwave systems including Synthetic Aperture Radar (SAR), Terra-SAR and PALSAR. These systems can penetrate ground cover to record underlying terrain and vegetation as well as the top of a forest canopy. It also has the benefit of penetrating cloud cover (Kumar and Mutanga, 2017). The resulting tree measurements can then be related to biomass through allometric equations and extrapolated across landscapes and regions into forest carbon zones or maps (Saatchi et al., 2011).

Example of forest biomass zones mapped at 1-km spatial resolution (extracted from (Saatchi et al., 2011))
Finally, LiDAR (light detection and ranging) systems send out pulses of laser light and measure the signal return time to directly estimate the structure of vegetation which can then be used in allometric equations and extrapolated over a landscape (Gonzalez de Tanago et al., 2017; Kumar and Mutanga, 2017; Saatchi et al., 2011).
Limitations
As with the other carbon assessment techniques, there are limitations in using remote sensing for estimating biomass and carbon stocks. Some of the major limitations identified in the literature may be summarised as follows:
- Ground-based data collection is needed to calibrate the results from remote sensing with field measurements and allometric equations for forest types. Studies often only have a small number of calibration plots or ground-truthing data to verify the remote sensing data (Clerici et al., 2016; Gibbs et al., 2007; Gonzalez de Tanago et al., 2017; Kumar and Mutanga, 2017).
- Tropical forests are structurally complex ecosystems and signals from remote-sensing instruments tend to saturate quickly leading to inaccurate results (Gibbs et al., 2007).
- Cloud cover, and changes in spectral properties of soil and atmosphere (e.g. from smoke) are common hindrances for satellite imagery techniques (Gibbs et al., 2007).
- Spectral confusion with between primary and secondary forests (including agroforests and tree crop plantations) is a common challenge and limited studies have been able to distinguish tree plantations from other vegetations such as secondary forests with a high degree of accuracy (Alfonso Ortega-Huerta et al., 2012; Chemura et al., 2014; Kumar and Mutanga, 2017; MacDicken, 2015).
- Detecting forest degradation can often only be detected at very high-resolution imagery only (MacDicken, 2015).
- Many remote sensing methods are still subject to the errors incurred in the selection of the allometric equations (Clerici et al., 2016; Gonzalez de Tanago et al., 2017).
I’m awaiting preliminary results from the first Terra-I classification run. I hope I can share the results in my next blog post!