Most of us have heard the term, carbon footprint. It is used to measure the total greenhouses gases directly and indirectly attributed to an individual, organisation or product. The carbon footprint includes all greenhouses gases, such as methane and (CH4), nitrous oxide (N2O). To be able to compare them on a like-for-like basis, CO2e is calculated by multiplying the emissions of each by its 100 year global warming potential (GWP) giving the CO2 Eq figure https://www.carbontrust.com/resources/guides/carbon-footprinting-and-reporting/carbon-footprinting

- Source: www.greeneatz.com
In the field of sustainable diets, we refer to the CO2 Eq of beef, lamb, pork etc. which allows one to quantify and compare the carbon footprint of eating, for example a kilo of beef versus a kilo of chicken. However, a quick glance at the literature and one soon sees the wide variation and difference in CO2-eg figures for products. Why is this the case? Why does one paper suggest the CO2 of beef is 17.4 CO2-Eq per kg of beef [1] and another gives a figure of 46.2 C02-Eq per kg of beef [2].
It all depends on how the Life Cycle Analysis (LCA) was conducted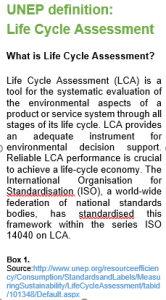 (the method used to quantify the carbon footprint of a product from cradle to grave for example, it looks at all inputs into ‘making’ the product – See Box 1.)
For example, the LCA boundary for beef in one study may only assess the emission from ‘cradle to farm gate’ thereby excluding all emissions post farm gate like energy associated with slaughter, transport, refrigeration and packaging. Another study may define its ‘functional unit’ of measurement as the CO2-Eq per LIVE weight of beef (excluding slaughter, transport etc.) or CO2-Eq per carcass weight (including slaughter, transport etc.) It may or may not account for associated land-use change (LUC) in beef production. For all these reason, when one wishes to compare carbon footprints they must acknowledge and account for the variations in LCA methods. As such, comparability of meat carbon footprints can be marred by a lot uncertainties [3] and caution should be taken when comparing one countries beef carbon footprint to another.
This was one of the greatest challenges of my thesis, choosing which carbon footprint to use for ‘meat’. As you can see from the below graphs, the CO2-Eq figures vary by geography, by LCA system boundaries and characterisation factors. The carbon footprint of beef can also vary based on the production system, for example was the beef apart of a pasture, organic or feedlot production system.
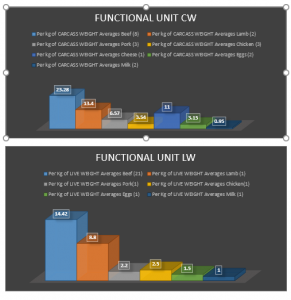
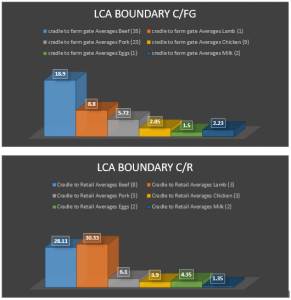
- Source: Authors Own
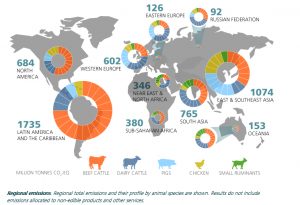
- Source: FAO Livestock emissions by region http://www.fao.org/gleam/results/en/
It is imperative that we develop a methodology to allow for comparsions on ‘meat’ carbon footprints and its good to see discussions on the need to harmonise LCA methods and approaches have already begun https://www.carbontrust.com/news/2016/02/footprints-without-borders-product-carbon-footprinting-framework-east-asia/.
Despite the geography, complexities and difference in the carbon footprint of ‘meat’ products – one message is clear, beef has the highest CO2-Eq and as such, the highest environmental and climate impact [2-5]. As a result, the need to reduce consumption is vital if we are to stay within the 2c target agreed this year at the UNFCCC Paris meeting.
References (numbered) link: http://www.plantagbiosciences.org/people/sinead-moran/bibliography/