
The sensitivity of comparative milk footprints from dairy farm systems implementing conventional and legume-based animal diets to choice of allocation method was accessed by analysing and comparing carbon footprints generated through the use of Feedprint NL and AgRe Calc using both mass and economic allocation methods, different dairy cow diets and different genetic merits.
It was found that mass and economic allocation methods, different dairy cow diets and different genetic merits can create very varied footprints. Table 7.1 to 7.4 show the averages for each of the cow groups. It can be seen in these tables that across all of the groups mass allocation generated a higher footprint then economic allocation. And it can be seen that the select cows had higher milk yield then the control cows and in turn a lower Milk EF (kg CO2-eq/L).
1.1 By product diet averages
| Economic BPC Average | Mass BPC Average | Economic BPS Average | Mass BPS Average | |
| System kg CO2-eq | 508989.3 | 2085834 | 568506.5 | 2331630.25 |
| Milk prod (L) | 433420.5 | 433420.5 | 545373.5 | 545373.5 |
| Milk EF (kg CO2-eq/L) | 1.18 | 4.83 | 1.04 | 4.28 |
*BPC = By product diet control, BPS = By product diet select
1.2 High forge diet averages
| Economic HFC Average | Mass HFC Average | Economic HFS Average | Mass HFS Average | |
| System kg CO2-eq | 529911.6 | 758624 | 504,980 | 654251.4 |
| Milk prod (L) | 405650.4 | 405650.4 | 433,361 | 433361 |
| Milk EF (kg CO2-eq/L) | 1.31 | 1.87 | 1.17 | 1.52 |
*HFC = High forge diet control, HFS = High forge diet select
1.3 Low forge diet averages
| Economic LFC Average | Mass LFC Average | Economic LFS Average | Mass LFS Average | |
| System kg CO2-eq | 497483 | 735,624 | 486775 | 691597.2 |
| Milk prod (L) | 479329.2 | 479,329 | 533950.2 | 533950.2 |
| Milk EF (kg CO2-eq/L) | 1.04 | 1.53 | 0.91 | 1.30 |
*LFC = Low forge diet control, LFS = Low forge diet select
1.4 Home grown diet averages
| Economic HGC Average | Mass HFC Average | Economic HGS Average | Mass HGS Average | |
| System kg CO2-eq | 430,483 | 840,371 | 474,597 | 910,055 |
| Milk prod (L) | 356,441 | 356,441 | 424,024 | 424,024 |
| Milk EF (kg CO2-eq/L) | 1.21 | 2.36 | 1.13 | 2.18 |
*HGC = Home grown
diet control, HGS = Home grown diet
select
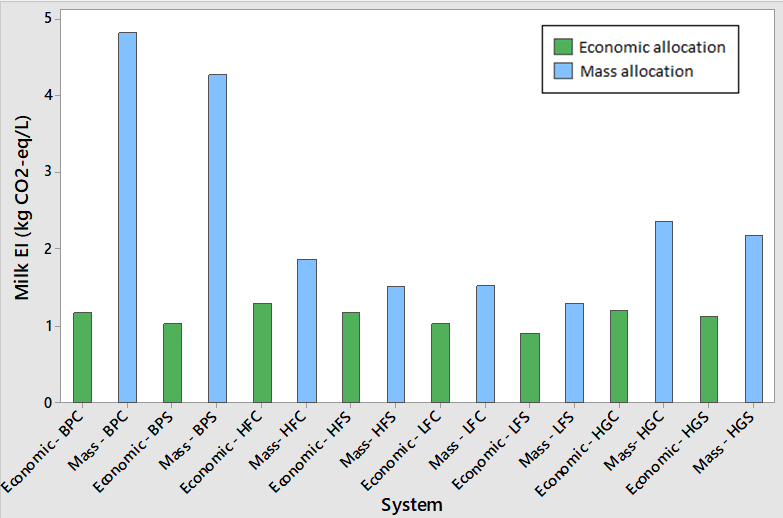
The bar chart in Figure 7.1 shows all the cow groups together and their average EF per litre of milk (kg CO2-eq/L). It can be seen that across all of the groups mass allocation generated a higher footprint then economic allocation. And it can be seen that the select cows had higher milk yield then the control cows and in turn a lower Milk EF (kg CO2-eq/L).
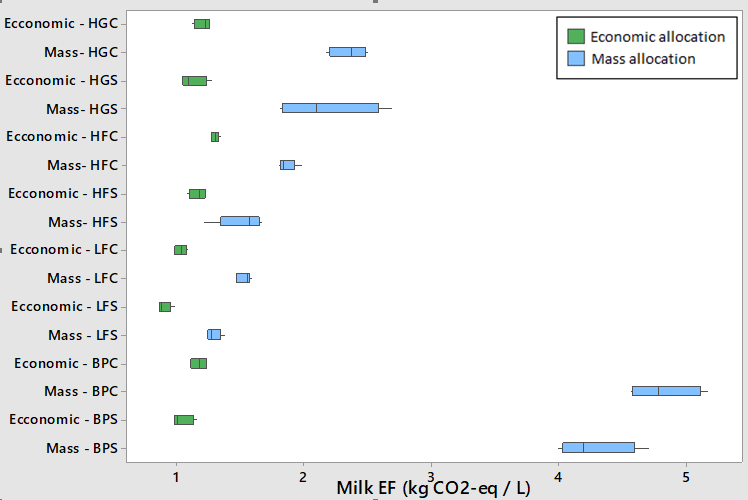
The box plot in Figure 7.2 shows all the cow groups together and their average EF per litre of milk (kg CO2-eq/L). It can be seen that across all of the groups mass allocation generated a higher footprint then economic allocation. And it can be seen that the select cows had higher milk yield then the control cows and in turn a lower Milk EF (kg CO2-eq/L). This also shows the averages for each of the cow groups.
It can be concluded that the use of mass and economic allocation
methods, the different dairy cow diets and the different genetic merits can have
substantial variance on footprints for dairy farms.