I have been continuing to work on my thesis, and the results from the data have given me plenty to work on. This is great but does mean I’m glued to the computer trying to get everything done while still preforming the juggling act that is my life. My mom is still in a lot of pain but is getting slowly better, slow progress is still progress. So overall my life/work balance in currently favouring the proverb “All work and no play makes Jack a dull boy”.
My breaks form the thesis consist of me getting to go outside for a jog but I’ll forever be thankful for being situated right beside the beautiful canal. It has so much flora and fauna that you just wouldn’t expect to see in a big city like Edinburgh.
The best thing is that the biodiversity is encouraged to grow and expand. They have bee boxes on the opposite bank of the canal, they don’t cut the vegetation too short along the banks so birds and ducks can make their nests.

The bee boxes and diverse vegetation along the canal
It was so great to see active bee boxes as I have seen too many bee boxes empty on my travels, it is well known that the number these essential little guys is declining, the video below by the FAO sums up the situation in a quick and factual manner.
I managed to get a photo of some ducks and swans in the canal, you can see the all the different types of vegetation, ideal for bees and other wildlife. My other attempts at photographing different birds have not been very successful as they blend into the vegetation which is good for them but not so good for my photograph attempts.
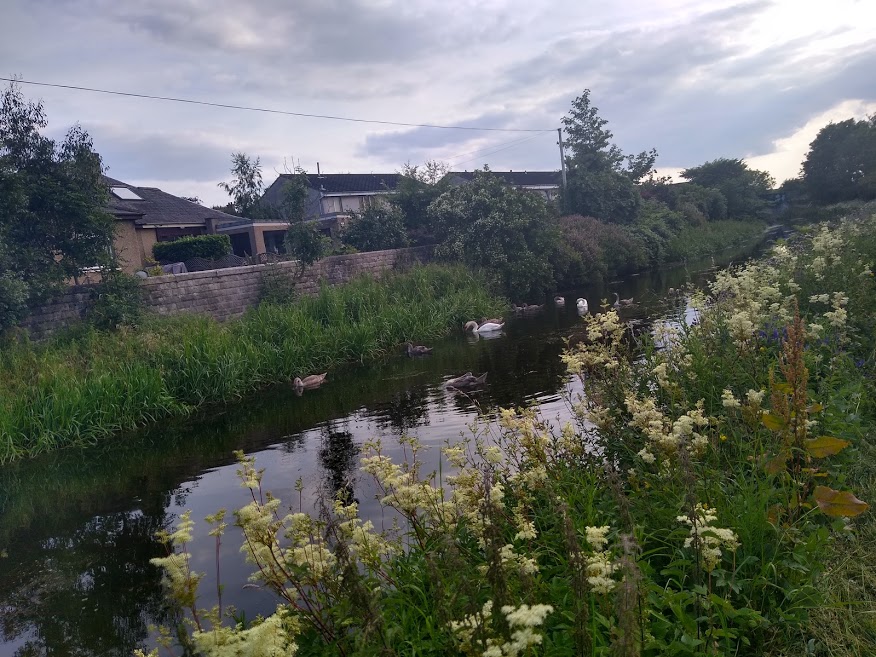
Swans on the canal 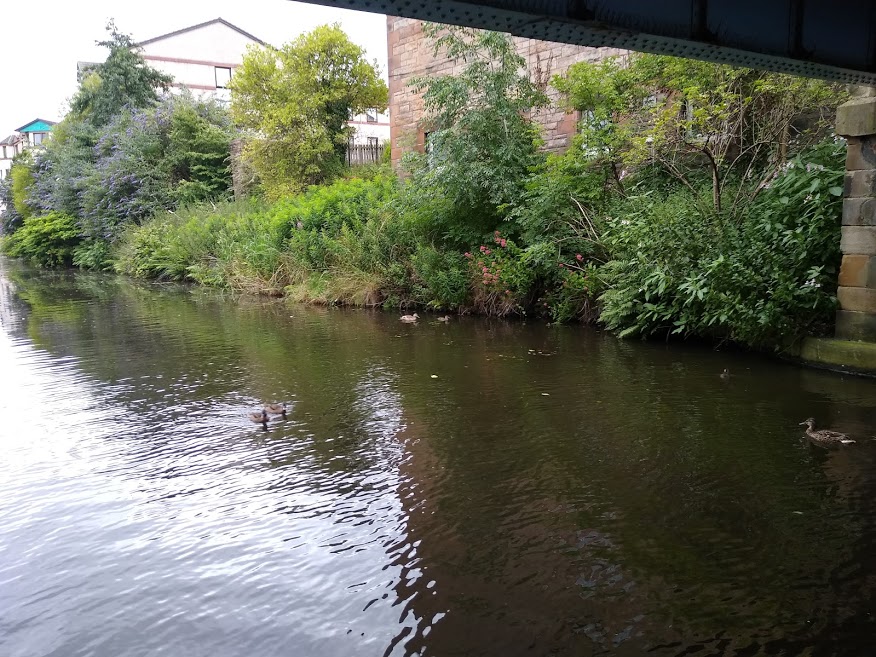
Ducks on the canal
Now to get back to the project, currently my findings from the data are showing that diets, genetics and allocation methods have major effects on the carbon footprints of cows.
The animals that have been part of the program include control cows and select cows, control cows have the same genetic merit as the national herd average, the select cows have a high genetic merit. So on average this means the select cows have a higher milk average then the control cows. This in turn means that the select cows have a lower carbon footprint per litre of milk, when the control and select cows are on the same diet. So the below tables are just on the By product diet, this diet consists of by product feeds generated during different processes, e.g wheat distellers during the distillery process. These tables show the different allocation methods and the difference between the control and select cows. Once the thesis is complete I will upload the results for all of the different diets on the results page but for now this is just a taster of what I am working on.
| Economic – By Product Control | |||||
| BPC_2012 | BPC_2013 | BPC_2014 | BPC_2015 | Average | |
| System kg CO2-eq | 553,008 | 514,893 | 461,791 | 506,265 | 508989.3 |
| Milk prod (L) | 499,421 | 415,240 | 380,634 | 438,387 | 433420.5 |
| Milk EI (kg CO2-eq / L) | 1.107298 | 1.239989 | 1.213217 | 1.154836 | 1.178835 |
| Mass – By Product Control | |||||
| BPC_2012 | BPC_2013 | BPC_2014 | BPC_2015 | Average | |
| System kg CO2-eq | 2,316,963 | 2,150,529 | 1,875,617 | 2,000,227 | 2085834 |
| Milk prod (L) | 499,421 | 414,240 | 380,634 | 438,387 | 433170.5 |
| Milk EI (kg CO2-eq / L) | 4.639297 | 5.179 | 4.927616 | 4.562695 | 4.827152 |
| Economic – By Product Select | |||||
| BPS_2012 | BPS_2013 | BPS_2014 | BPS_2015 | Average | |
| System kg CO2-eq | 553,104 | 529,255 | 551,627 | 640,040 | 568506.5 |
| Milk prod (L) | 561,972 | 532,108 | 539,165 | 548,249 | 545373.5 |
| Milk EI (kg CO2-eq / L) | 0.98422 | 0.994581 | 1.023114 | 1.167425 | 1.042335 |
| Mass – By Product Select | |||||
| BPS_2012 | BPS_2013 | BPS_2014 | BPS_2015 | Average | |
| System kg CO2-eq | 2,240,678 | 2,211,958 | 2,288,705 | 2,585,180 | 2331630.25 |
| Milk prod (L) | 561,972 | 532,108 | 539,165 | 548,249 | 545373.5 |
| Milk EI (kg CO2-eq / L) | 3.987171 | 4.15697 | 4.244908 | 4.715335 | 4.276096 |
From the tables above you can see that mass allocation average the kg CO2-eq per litre of milk is nearly 4 times as much as the economic allocation average the kg CO2-eq per litre of milk. And it is possible to see that the Select cows have a lower average the kg CO2-eq per litre of milk then the control cows as they produce high yields of milk on average.
Now I shall go back to the writing the thesis and generating the necessary statistics, maybe if I’m lucky I might manage to have enough time to go for a jog by the canal.