The domains’ map shows that feed scarcity is one of the factors which constrain livestock productivity, thereby compromising livelihoods in the mixed farming systems of Kenya, Tanzania, and Uganda. Therefore the recommendations of this study will be instrumental in closing the feed scarcity gap and improve livestock productivity for better livelihoods.
However, it is very important to understand that there is not one feed intervention which is ideal to solving all the feed scarcity issues but, integrating two or three feed interventions recommended for each domain may eliminate all the feed scarcity constraints which exist within a certain domain. One feed intervention may deal with seasonality and the other may deal with quantity thus, their combined effect can eliminate the feed constraint according to mitigation potential.
Month: August 2018
Recommended or predicted feed interventions for each domain
Domain 16 was interpreted as an area of very low feed quantity, 12 months of feed scarcity, very low land availability and medium water availability.
Suitable feed interventions
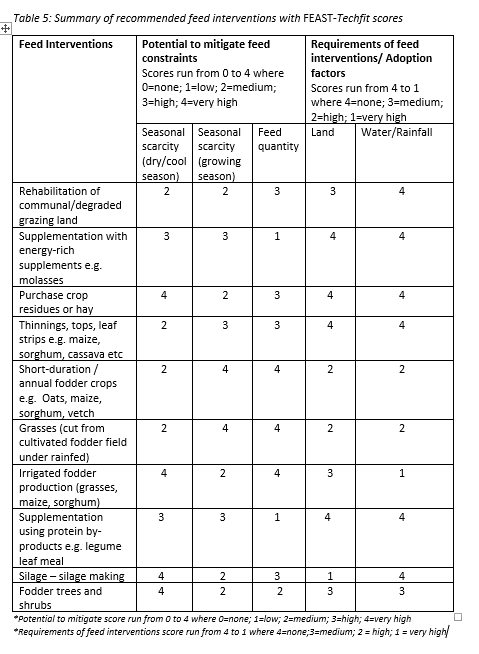
The FEAST-Techfit table shows that interventions such as rehabilitation of degraded grazing land may be an attractive option for this domain as it shows very low land availability which may be due to degradation (soil loss). Rehabilitation of degraded land has a potential to restore land and improve forage availability for sustainable livelihoods. Supplementation with energy-rich supplements such as molasses may be a suitable intervention in this domain as it has a high potential to mitigate feed scarcity during the dry or cool season and feed scarcity problems during the growing season and has no land requirements. However, molasses deals well with feed scarcity but has a low potential to solve feed quantity problems. Therefore, the feed quantity gap can be closed by adopting the use of purchased crop residues or hay given its high potential to mitigate feed quantity. In addition, most of the mixed farming systems of East Africa grow maize, sorghum, sugarcane and cassava (Valbuena et al., 2012), therefore, the use of thinnings, tops and leaf strips of crops such as maize, sorghum and cassava are most likely to receive a positive response in terms of uptake as it is a cheap option with no requirements for more land and can be accessed on farm.
Domain 7 was interpreted as an area of low feed quantity, 11 months of feed scarcity, low land availability and very high-water availability.
Suitable feed interventions
The FEAST-Techfit table show that the practice of supplementing feed with protein by-products such as legume leaf meal and oilseed may be suitable for this domain given the practice's high potential to mitigate feed scarcity during the growing season and feed scarcity during the dry or cool season. However, supplementing feed with by-products does not deal with the feed quantity constraint. Therefore, the feed quantity gap can be prevented by adopting the use of thinnings, tops and leaf strips of crops which are cultivated on-farm such as maize, sorghum, cassava, depending on the crop in season. As this domain receives very high rainfall, the practice of rainwater harvesting may be essential as it may enable farmers to adopt irrigated fodder production to close the feed quantity gap.
Domain 4 was interpreted as an area of medium feed quantity, 6 months of seasonal scarcity, very high land availability and medium water availability
Suitable feed interventions
The FEAST-Techfit table show that short-duration or annual fodder crops such as oats, maize, sorghum, vetch are a suitable for this domain considering that this domain has very high land and adequate water availability. However, annual fodder crops only solve problems of feed quantity and feed scarcity during the growing season, leaving a feed scarcity constraint during the cool and dry season. Therefore, fodder trees and shrubs such as Calliandra calothyrsus and Leucaena diversifolia could be a suitable option which can be integrated with the use of annual fodder crops given their potential to mitigate feed scarcity during the dry season or cool season, and their land requirements match the context of the mixed farming systems in this domain.
Domain 2 was interpreted as an area of very high feed quantity, 3 months of seasonal scarcity, low land availability and high water availability.
Suitable feed interventions
The FEAST-Techfit sheet table reveals that irrigated fodder production may be an attractive option given its low land requirement and its potential to mitigate feed scarcity during the cool or dry season and feed quantity problems. The feed scarcity gap during the growing season can be mitigated by integrating the use of energy-rich supplements such as molasses and the use of protein by-products such as legume leaf meal.
FEAST-Techfit feed intervetions suitable for each domain.
The domains’ map shows that feed scarcity is one of the factors which constrain livestock productivity, thereby compromising livelihoods in the mixed farming systems of Kenya, Tanzania, and Uganda. The table below shows feed interventions which were discovered by Lukuyu and Duncan, (2014) using the feed assessment tool FEAST. The scores show the potential of each feed intervention to prevent feed constraints and the factors which influence the adoption of each feed intervention. The FEAST-Techfit module scores the candidate feed interventions from low to very high, depending on the intervention’s potential to mitigate feed constraints. Therefore, this table was used to recommended or predict suitable interventions according to domain properties (i.e. feed quantity, months of feed scarcity, land availability and water availability)
For more information about the FEAST go to the link below:
https://www.ilri.org/feast
For more information about the FEAST-Techfit visit the link below:
https://feeding-innovation.ilri.org/2017/02/27/feast-feed-sheets/
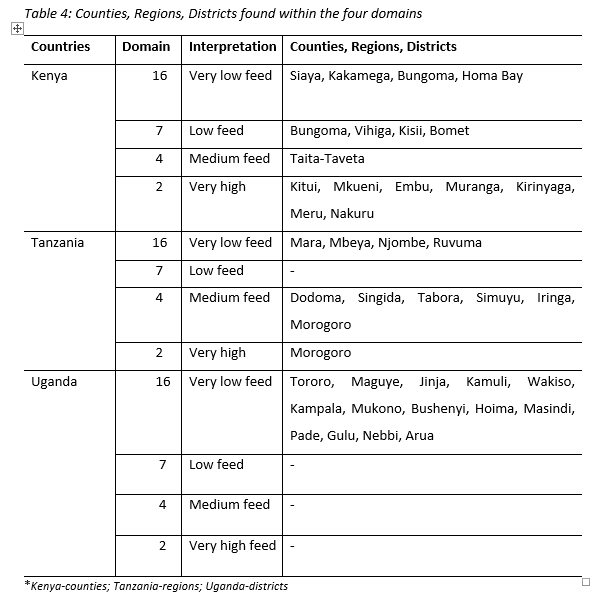
Counties, Regions, Districts found within the four selected domains
On my previous post I shared interpretations of all the 16 domains. However, for this MSc research project I selected four highly contrasting domains and those were domain 16, 7, 4 and 2.
The main reason behind producing a map showing the 16 domains, was to identify specific counties in Kenya, specific regions in Tanzania and specific districts in Uganda with feed scarcity problems in order to recommend or predict feed intervention which are suitable to close the feed quantity and feed scarcity gap. The table below shows the specific counties, regions and districts found within the four domains which were selected for this MSc research project. There is something interesting which is revealed by this table. The table shows that Kenya and Tanzania was found within all the four domains, which implies that different counties and regions have varying quantities of feed (some have very low and some have high feed quantity). However, Uganda reported the opposite given that domain 16 was the only one found in all the mixed farming systems of Uganda and this domain indicates that the area experiences twelve months of feed scarcity, very low feed quantity and no land for forage production. The other two domains which represent high (domain 2) medium (domain 4) feed quantity were not found in Uganda. This is an indication that livestock productivity may be hampered by the scarcity of feed resources, thereby risking livelihoods of the people who depend on livestock production. Over and above all, there is an urgent need to introduce feed interventions which match the land and water availability context of the counties, regions and districts found in domain 16 and 7.
Four domains of feed availability and adoption factors
This is a map showing the four highly contrasting domains of feed availability and adoption factors.
![]()
Interpretations of the sixteen (16) domains
This is a map produced from overlaying the four maps (feed quantity, feed scarcity, land availability, water availability). It shows 16 domains which indicate feed availability in Kenya, Tanzania and Uganda. I have included interpretations which explain what each of the sixteen domains represent in terms of feed quantity, seasonal scarcity, land availability and water availability. These interpretations will be used to predict and recommend feed interventions suitable for the varying domains.
Domain 1: Low feed quantity
• 11 months of seasonal scarcity/ Low land availability/ High water availability
Domain 2: Very high feed quantity
• 3 months of seasonal scarcity/ Low land availability/High water availability
Domain 3: Very low feed quantity
• 12 months of seasonal scarcity/ Low land availability/ Medium water availability
Domain 4: Medium feed quantity
• 6 months of seasonal scarcity/ Very high land availability/ Medium water availability
Domain 5: Very low feed quantity
• 12 months of seasonal scarcity/ Very low land availability/ very high-water availability
Domain 6: Very low feed quantity
12 months of seasonal scarcity/ Very low land availability/ High water availability
Domain 7: Low feed quantity
• 11 months of seasonal scarcity/ Low land availability/ Very high-water availability
Domain 8: Low feed availability
• 11 months of seasonal scarcity/ low land availability/ high water availability
Domain 9: Very low feed quantity
• 12 months of seasonal scarcity/ Very low land availability/ High water availability
Domain 10: Very low feed quantity
• 12 months of seasonal scarcity/ low land availability/ High water availability
Domain 11: Very low feed quantity
• 12 months of seasonal scarcity/ Very low land availability/ High water availability
Domain 12: Low feed availability
• 11 months of seasonal scarcity/ low land availability/ medium water availability
Domain 13: Low feed quantity
11 months of seasonal scarcity/ very low land availability/ medium water availability
Domain 14: Low feed availability
• 11 months of seasonal scarcity/ Very low land availability/ High water availability
Domain 15: Very low feed quantity
• 12 months of seasonal scarcity/ Very low land availability/ Medium water availability
Domain 16: Very low feed quantity
• 12 months of seasonal scarcity/ Very low land availability/ Medium water availability
mfakude
Now that I have produced the four maps, The next step is to overlay these four maps on GIS to produce a single map which will show 16 domains. These domains will be produced from a cluster analysis.The cluster analysis will group features based on raster attributes or similar properties. For instance, areas of low feed quantity will be clustered as one domain, areas of high feed quantity to one domain. Areas of low feed scarcity to one domain and areas of high feed scarcity to one domain. The same will apply for land availability and water availability.
So be on the look out as I will publish the map showing the domains soon!
Feed scarcity map is ready!
Feed scarcity was defined as the number of months with feed quantity less than the requirements of one tropical livestock unit (TLU). Feed scarcity was derived by comparing long-term (2008 - 2017) monthly dry matter production trend against standard feed requirement of one TLU (6.5 kg DM cow/day). This map shows ordinal values running from 0 to 12. Twelve (12) meaning all year feed scarcity per cow given the long-term trend of monthly feed quantity per cow and Zero (0) representing all year feed availability per cow.
![]()
Feed quantity map is ready!
In this study, feed quantity was defined as available feed per animal. This map shows the trend in available feed in kilograms of dry matter per cow per day (kg DM cow/day) from the year 2008 to 2017. The red represents areas characterized by low feed quantity, which may have influenced poor livestock productivity in the mixed systems. The green represent areas characterized by high feed quantity which may have enhanced improved livestock productivity.
![]()
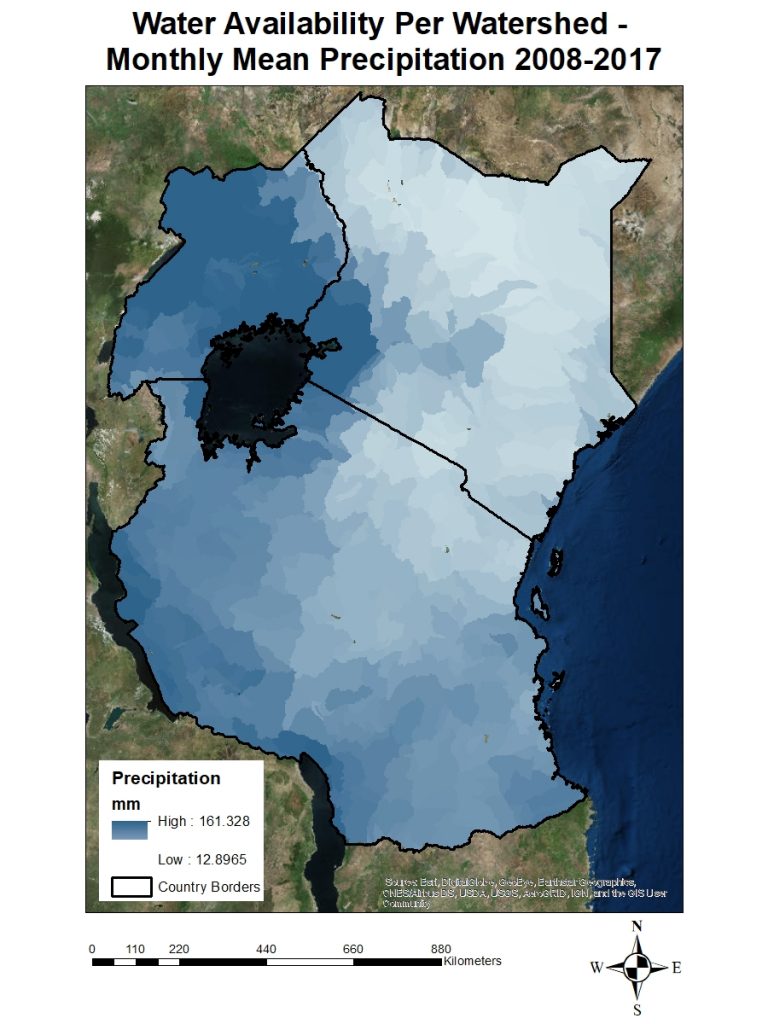
Water availability layer is ready!
The water availability layer for Tanzania, Kenya and Uganda has been produced. This output shows a total time frame precipitation average for the years 2008 to 2017, and the sum of the monthly average per watershed. The blue represents high water availability and it is an indication that water availability may not limit the adoption of feeds and forage which require water or soil moisture. However, the light blue to white areas show areas where water availability may limit the adoption of feed interventions which require water or high soil moisture.