On my previous post I shared interpretations of all the 16 domains. However, for this MSc research project I selected four highly contrasting domains and those were domain 16, 7, 4 and 2.
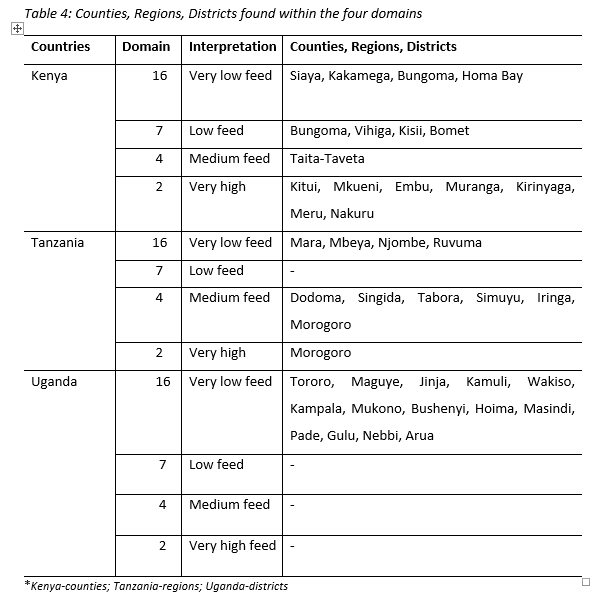
The main reason behind producing a map showing the 16 domains, was to identify specific counties in Kenya, specific regions in Tanzania and specific districts in Uganda with feed scarcity problems in order to recommend or predict feed intervention which are suitable to close the feed quantity and feed scarcity gap. The table below shows the specific counties, regions and districts found within the four domains which were selected for this MSc research project. There is something interesting which is revealed by this table. The table shows that Kenya and Tanzania was found within all the four domains, which implies that different counties and regions have varying quantities of feed (some have very low and some have high feed quantity). However, Uganda reported the opposite given that domain 16 was the only one found in all the mixed farming systems of Uganda and this domain indicates that the area experiences twelve months of feed scarcity, very low feed quantity and no land for forage production. The other two domains which represent high (domain 2) medium (domain 4) feed quantity were not found in Uganda. This is an indication that livestock productivity may be hampered by the scarcity of feed resources, thereby risking livelihoods of the people who depend on livestock production. Over and above all, there is an urgent need to introduce feed interventions which match the land and water availability context of the counties, regions and districts found in domain 16 and 7.