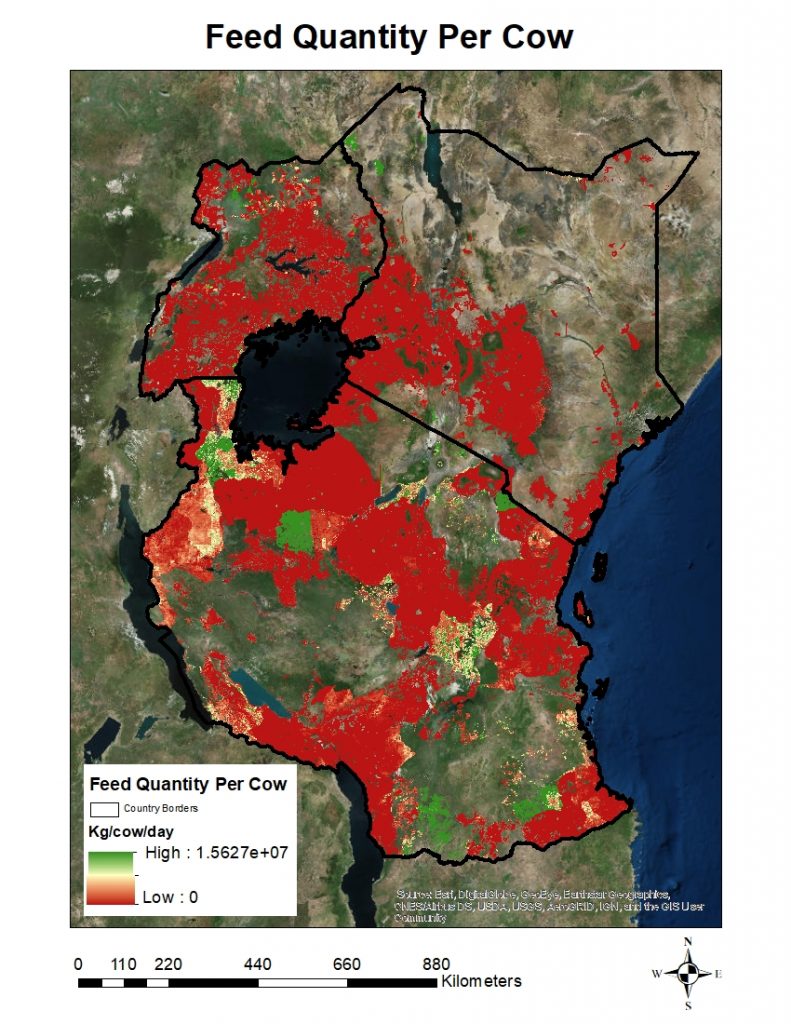
In this study, feed quantity was defined as available feed per animal. This map shows the trend in available feed in kilograms of dry matter per cow per day (kg DM cow/day) from the year 2008 to 2017. The red represents areas characterized by low feed quantity, which may have influenced poor livestock productivity in the mixed systems. The green represent areas characterized by high feed quantity which may have enhanced improved livestock productivity.

MSc in Climate Change, Agriculture and Food Security
