After settling on the proxy indicators presented on the previous mapping update, I looked for organisations which were in position to provide the proxy indicator's data. The purpose of this post is to share the sources which provided the data used to produce the four layers or maps.
Four maps
- Feed quantity
- Seasonal feed scarcity
- Land availability
- Water availability
In this study, feed quantity was defined as the available feed quantity per animal. Seasonal feed scarcity was defined as the number of months with feed quantity less than the requirements of one tropical livestock unit (TLU). Therefore, the following sources provided data which was used to produce the feed quantity and Seasonal feed scarcity maps:
• Copernicus Global Land Services provided Net Primary Productivity (Dry Matter Productivity) data from 2008 to 2010 and Land cover data from 2015 to 2016.
• International Livestock Research Institute (ILRI) Datasets Portal provided livestock production systems which was used to extract the mixed farming system data of East Africa.
• Food and Agriculture Organization (FAO) provided a pasture density layer which was used to calculate the fraction of dry matter production used as livestock feed.
• Food and Agricultural Organization (FAO) provided Global Cattle Density data which was used to determine annual feed production per animal.
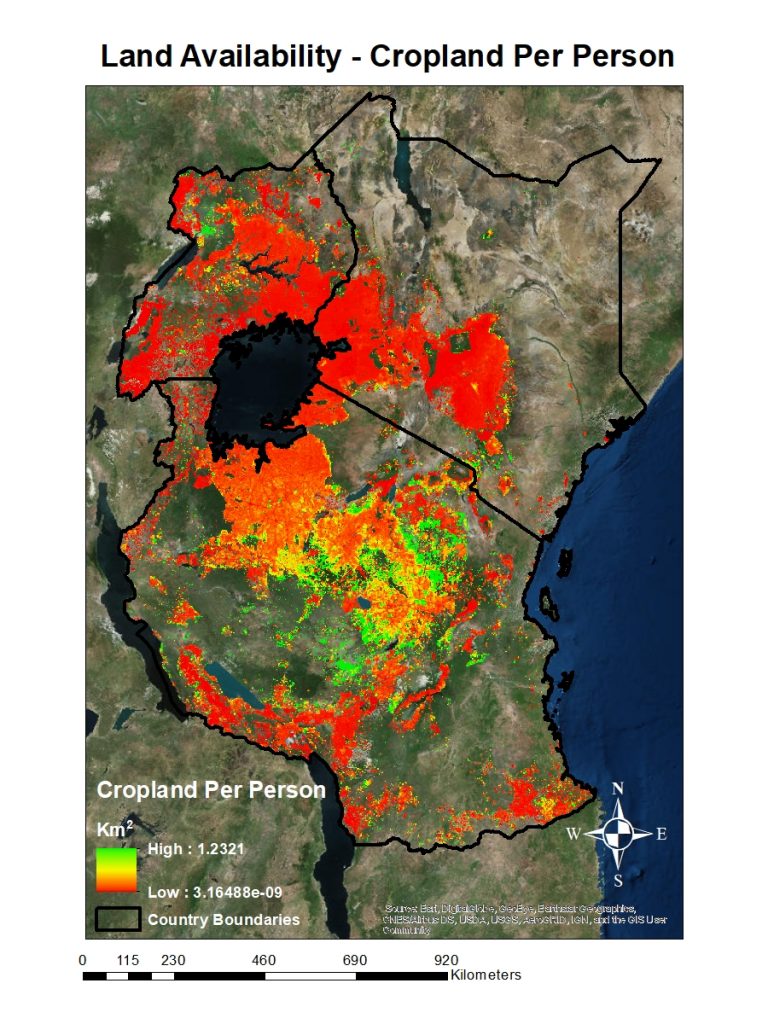
Land availability was defined as the cropland area available per person. The following sources provided data which was used to produce the land availability layer:
• Worldpop provided population density data.
• International Institute for Applied System Analysis (IIASA) provided crop area data.
Water availability was defined as the amount of rainfall and inflow accumulation in a given area.The following sources provided data which was used to produce the water availability layer:
• National Oceanic and Atmospheric Administration (NOAA) was provided rainfall distribution maps from 2008 to 2017.Thereafter, data for deriving flow accumulation was acquired from (Lehner et al., 2008)