Nutrition Security and Environment Sustainability

Hello again!

So I am back again to provide a clearer view of GAIN, the programs this organisation has been running over the years and just how my project fits in to what they have been doing;

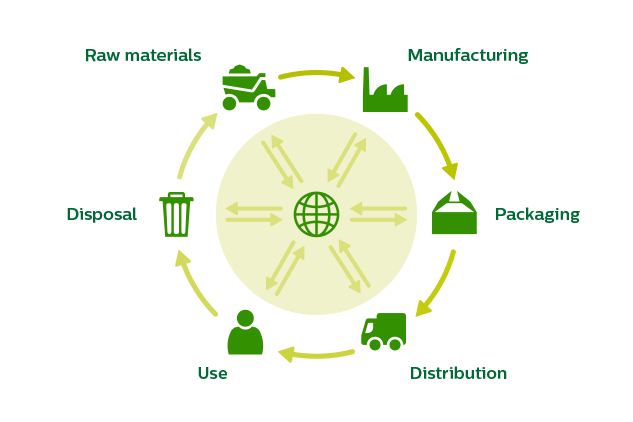
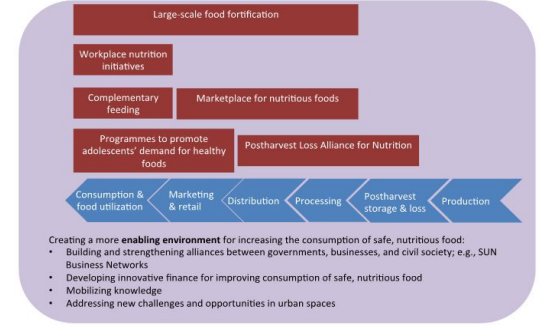
In the year 2002, Global alliance for Improved Nutrition (GAIN) was officially established with a goal of working together with public and private sectors to end malnutrition (Moench-Pfanner and Van Ameringen, 2012) . GAIN has adhered to this commitment by striving to making healthier food choices more affordable, more available and more desirable. In these efforts GAIN, has leveraged to improve nutrition outcomes by enhancing the consumption of nutritious and safe food, especially to the vulnerable, in recognition that the food system can only be fixed by a collective global effort. Their work has been organized into different following programme areas, operating in an interlinked way along the food value chain, concurrently cooperating with various partnerships and alliances as described in fig 1.

 To enhance nutrition outcomes by improving the consumption of nutritious and safe food for all people, especially the most vulnerable. – GAIN’s Vision and Purpose

Fig 1: GAIN Products and Services Along the Food Value Chain

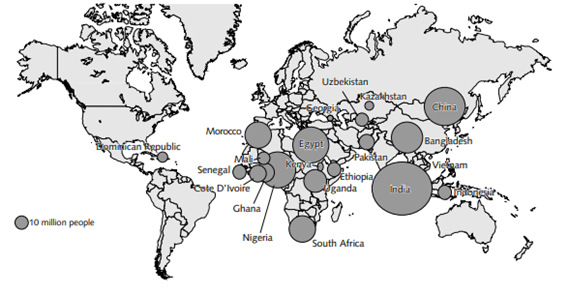
One of GAIN’s major programs has been that of large-scale fortification of food, whereby the program was initially launched in 2003 (Guinot et al., 2012).  Within less than a decade these operations have been upscaled to reach more than 610 million people with nutritionally enhanced food (Moench-Pfanner and Van Ameringen, 2012) as described in figure 2.

Fig 1: Map of GAIN large-scale fortification coverage ( Moench-Pfanner and Van Ameringen, 2012)

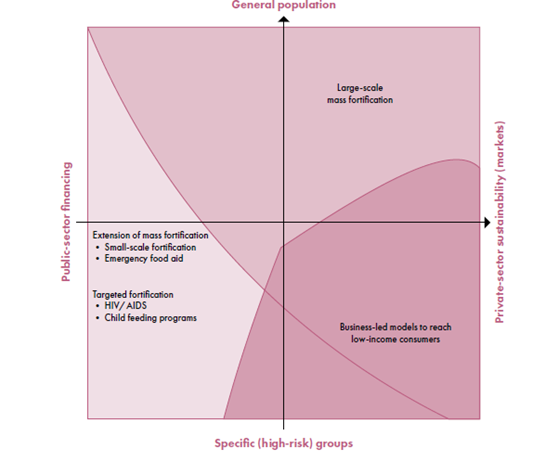
GAIN’s strategy towards large-scale food fortification, which has developed extensively (through the years due to initial challenges) , involves development of complementary approaches for the delivery of fortification recognizing the limitations of large-scale fortification to reach the entire population in some countries . The framework below, developed by GAIN, displays how various program delivery approaches can complement one another and reach different groups of the population. The objective of the layered approach includes; firstly, to attain a wide coverage of the total population as possible; and secondly to make certain that targeted nutrition interventions meet the needs of specific high-burdened segments of the population (Moench-Pfanner and Van Ameringen, 2012).

Source: (Hoogendoom et al., 2017)

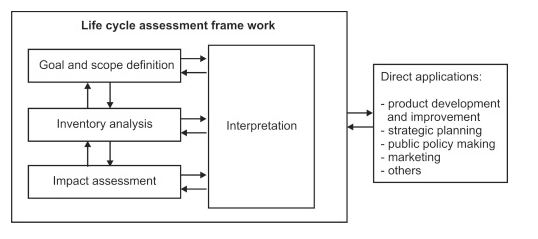
However, while, its globally significant to ensure that food is nutritious and secure, it is also essential that such efforts do not antagonize various endeavors already present in dealing with climate change or do not contribute to worsened impacts on the environment. Thus, it is important to be able to categorize and understand the relevance that approaches such as food fortification have in relation to adapting to the Earths changing climate (Adaptation) and reducing Greenhouse gas emissions (GHG) (Mitigation)  (Harvey et al., 2014)

How does my project fit in?

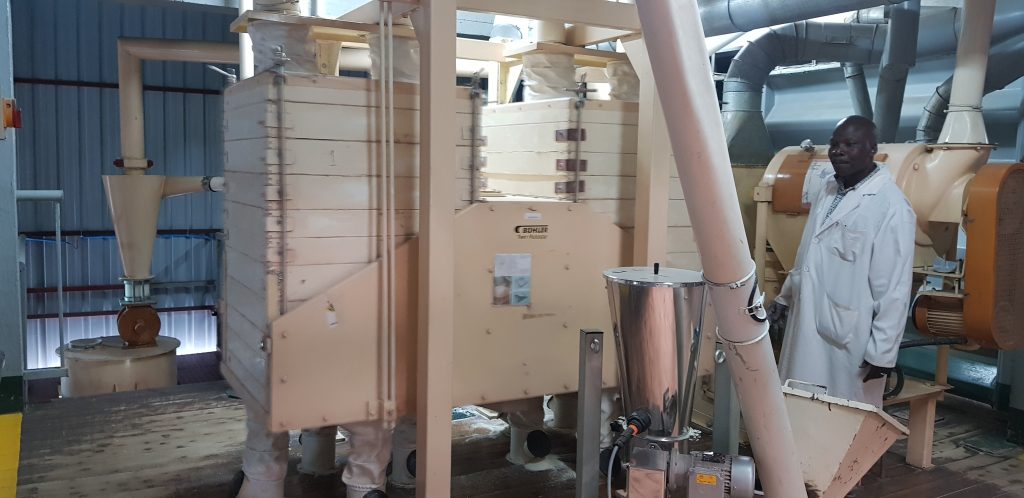
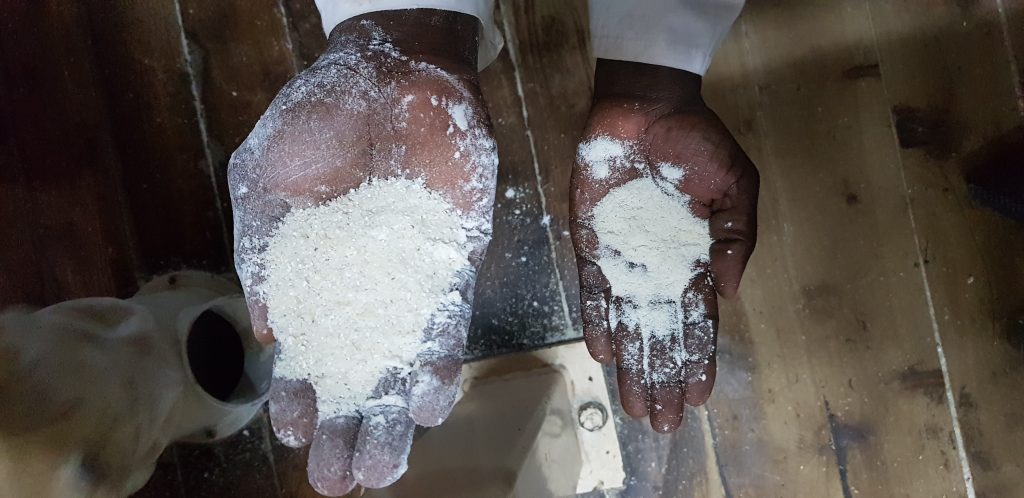
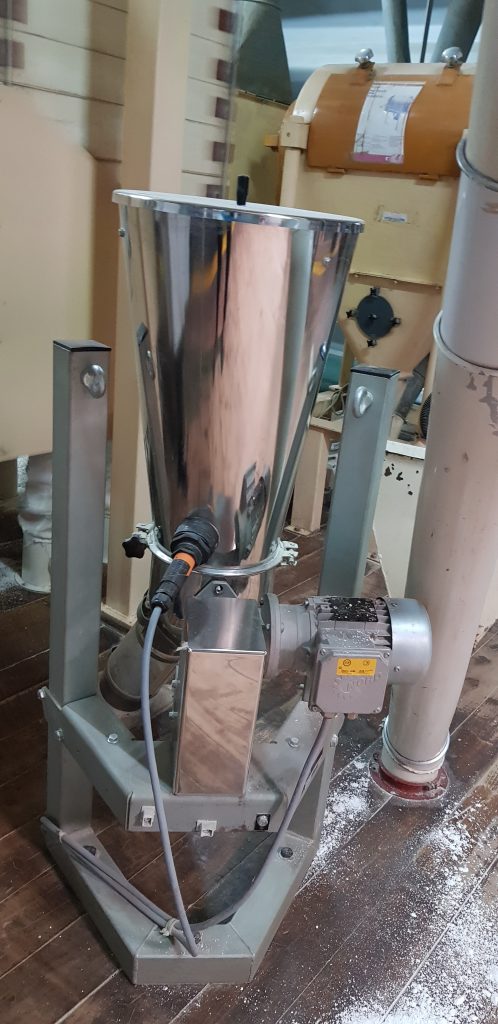
My project aims to support GAIN’s work by specifically focusing on large-scale food fortification seeking to understand where it stands in terms of its impact to the environment . The research goal, in pursuit of ensuring a continued delivery of quality nutritional outcomes, aims to map out major hotspots within fortification value chains of wheat and maize, that impact the climate by assessing their associated carbon equivalents.

The objective of this analysis simply seeks to;

To provide a comprehensive review of the resource footprint of food fortification value chains of wheat and maize and attempt to review its impact pathway.

To analyse the supply chain sustainability of constituents necessary for food fortification delivery in East Africa, identifying the lowest -resource footprint options

To categorize how large-scale food fortification can directly and indirectly contribute to adaptation of climate change in East Africa.

In my next post, I will discuss on research findings, interpretations, research challenges and possible areas for future research.

Cheers!

Adios GAIN Tanzania

Friday, the 9th of August 2019, was my last day at GAIN, Tanzania offices. I traveled back to Ireland that weekend to complete the remaining work on my project.

Overall it has been a wonderful experience working as part of an international organisation. I was impressed to find that , GAIN having offices in several parts of the world have a healthy ,cultural intelligent -environment, where diversity is managed in a positive way . This, I observed through monthly online meeting sessions where the engagement among all offices fosters creativity, ensuring multiple ways for team members to participate and contribute to the objectives of the organization.

I also like that GAIN has built a constructive platform where members deliver specific results in a coherent sequence . This taught me the significance of been ready to deliver at all times, been confident with ones results and been open to getting constructive criticism.

GAIN’s staff have generally been very supportive and cooperative. Moreover, with my excellent supervisors from GAIN , I definitely had no complains! Below is a picture of a farewell lunch, the GAIN, Tanzanian team organised for me before my departure.

Its funny this is the only picture taken! That moment when talks and food take a ride of everything 😁😅😅

As of current, I am racing with my write-up since the final deadline for submission is on the 25th of August. I’m working on my results and discussion, concurrently adjusting feedback on past chapters from my lecturers.

This week is going to be hectic one, but I’m sure I’ll eventually be done 😢😰.

Cheers!

Visit to industrial sites

As I mentioned, in my last post, my visit to Arusha was mainly aimed at visiting large-scale industrial sites for the specific food vehicles I am looking at. I thus, visited Kijenge Animal Products (Ltd) , specifically looking at their Ken-milling industry (as the site also comprises of a feed-mill and coal industry). Additionally, I visited Jimbo industry which processes wheat.

I never really imagined that so many processes and machinery are involved in maize and wheat flour production, however is was a great learning experience.

The industry staff where cooperative and ran me through the whole procedure involved from receiving raw kernels, cleaning, milling and packaging products. They where also willing to share records of production describing volumes received, cleaned, screened, co-products produced and final product quantities. These records also indicate the various electricity and fuel quantities needed for production. Below, I share briefly the steps involved in production of fortified maize flour (as wheat flour production is quite similar) and the lessons learnt:

Kenmill industry, Arusha Tanzania

Step 1 of processing: Receiving

Maize is received from different areas in Tanzania including Kiketo, Singida, Arusha, Tunuduma and Babati . The Kenmill industry receives an estimate of 60 tonnes per day. The off loading work is performed manually, and an elevator is used to arrange maize packages in store areas.

Offloading of received maize
Transporting truck..
Maize storage area

An procedure is performed to assure the quality of the maize acquired. Random samples are taken from different maize bags and tested. Poor quality maize eg, maize infected my alfatoxins that is not fit for human consumption is rejected. This rejected wheat is often taken to the Kap-feeds and utilized as food for animals eg. chicken. If the quality is too poor it is thrown away- landfill.

This is a grinder machine used to grind maize into small sample particle to be analysed

Lab sifter used to analyse various small particles. Particles are sifted to differ according to the standards required eg, larger particles

There are quality control analysis forms that keep records of results of samples tested. Features analysed according to standard parameters within maize kernels include: foreign matters, infestation, sprouted maize kernels, moldy grain, heat and insect damaged kernels, immature, musty odored and kernels that are contaminated. The moisture content is also measured.

Moisture-meter used to measure the protein, moisture, ash and other parameters in maize kernels.

Step 2: Cleaning

This stage involves removal of unwanted objects so as the maize kernels will be clean for processing. The process takes away chaffs, stones, metals, sticks, dust etc. All foreign material and all that is not maize kernels from the to-be milled grain that lowers the quality of the product such as husk, straw, sand, and everything too big or too small and lighter than a maize.

At each stage, a scale measures the volume quantities of maize that progresses through to next stages and volumes of waste released.

Machine elevators involved in cleaning.
Deposition of unwanted material in sacks.
Stones….
Cobs and chaffs..
Measuring scales computing volumes along each stage of production
Clean maize..

Step 3: Conditioning

Conditioning refers to the addition of moisture (water) to the maize to allow the bran to be peeled off in flakes before milling with plate or roller mills. This allows easier separation in a sifter and, most importantly to add mass to the meal.

Conditioned kernels that are peeled off in flakes.

Step 3: Milling

Maize that is hammer milled would generally represent an undefined class, probably closest associated with special sifted maize meal and represents the lowest cost option and more appropriate for many rural applications. This form of maize is known as bran. Bran produced is collected by a bran-collector.

The roller-mill machine grinds maize, Maize that is grinned is passed through a sifter that separates the particles accordingly. Maize is milled concurrent to different grading depending on its utilization. Particle sizes may differ say for flour to be used for breweries or normal flour used for consumption.

Bran….
Roller-mill and sifter…
Different grading of maize flour…

Step 4: Fortification process

Fortification occurs as one of the final procedures to milled flour. The milled flour is passed through conveyors towards a machine that adds specific amounts of premix mixtures (fortificant combinations) to the flour. The amounts of these micro-nutrients added are minimum whereby 0.5 kg of premix is added to 1 tonne of maize flour according to East African Standards, 2012. East Africa standard fortification mix comprises of Vitamin A, Vitamin B1, Vitamin B2, Niacin, Vitamin B6, Folate, Vitamin B12, Iron and Zinc. Tanzania however, fortifies it flour with all micro-nutrients mentioned except Vitamin A.

Micro-feeder conveyor involved in addition of premix
Premix…

Step 5: Packaging

There is small packaging ( 1- 10 kg) and large packaging (25-50 kg). These are than stored in wait for there distribution to various areas.

Machine used to fill polyethene bags with maize flour.
From left: The food production manager, Me and the Lab technician. These are staff from the Ken-mill industry who walked me through the maize flour production at industrial level .

The process above utilizes electricity. The amount of production varies between seasons depending on the availability of maize according to the production manager. The industry is able to process 75 tonnes in 24 hours.

Additionally, there is a quality assurance check from each stage of production to ensure the flour produced meets the standards for consumption. Thus samples are taken at each stage and measured concurrent to the grading required.

In the coming posts, I am going to clearly outline what my project seeks to assess and the relevance of visiting these large-scale fortification industrial sites and also how this fits in with GAIN’s objectives for the future.

That will be all for today…

Cheers!

Sites from Tanzania

Last week I traveled to Arusha region, located in the northeastern part of Tanzania to visit some large-scale fortification industries involved in the processing of maize and wheat. While I intend to give detailed illustration on the visit and some key things learnt (in later posts), I did enjoy a good scenery of Arusha and would like to share some of these beautiful natural features with you all.

Arusha region is among the largest tourist attraction locations in Tanzania. This is due to its diverse wildlife safari’s, big mountains like Mt. Kilimanjaro and Mt. Meru as well as the indigenous culture that still exists in the area like the Maasai tribe. The season of June to October, is the usual time-phrase for many tourists to visit the region due to drier conditions and suitability to especially climb mountains.

Image result for mountain kilimanjaro
The beautiful Mt. Kilimanjaro that rises on Tanzania -Kenya border and is the highest mountain in Africa. It is 19,340 feet (5,895 meters) above sea level .
Related image
Mt. Kilimanjaro has snow caps on its peak and comprises of three volcanic cones. The mountain snow capes are sadly diminishing, having lost more than 80 percent of their mass since 1912 (Nelson, 2010). Annually many people attempt to climb and reach the summit of this mountain however, not everyone is successful due to altitude related problems. The average days to climb to the mountain summit ranges from 6 to 9 days. I personally have not climbed this mountain yer, however this is definitely a year 2020 goal!!!!
Image result for mountain kilimanjaro sunset
Lovely sunset view of ‘Mt.Kili ‘ as some people call it.
Image result for mt meru in arusha
This is Mt. Meru located 70 km west of Mt Kilimanjaro. It is a dormant stratovolcano and its height is 4,562.13 meters. Climbing to the summit of this mountain takes an average of 2 to 3 days.
Above view of Mt Meru, in Arusha National Park. The mountain offers a good preparation climb for Mt Kilimanjaro (Mt Meru is the second largest mountain in Tanzania). Although even hiking and camping on the slopes or visiting the ash cone in the much lower crater provides great walking safaris . One thing so wonderful about this scenery is that in the lower slopes there preside diverse wildlife and stunning vegetation.
Image result for arusha national park
Can you imagine that this is actually a fig tree trunk ?! A definite ‘signature fig tree indeed’
Related image
The ‘ African Buffalo’
Image result for arusha national park
Elephants…………….Believe me these animals are scary in real life!
Image result for arusha national park
Giraffes in their glory………………..! you don’t see this in Ireland for sure.
Image result for arusha national park
Zebra’s……………
Image result for arusha national park
Even animals have social gatherings…………
Image result for flamingos at arusha national park
Flamingo’s ………….Breathtaking.
Image result for woman maasai
Image result for maasai people from arusha region
The Maasai people, pastoralists known for their strong culture, colourful attire and admirable works of craft. These groups of people are majorly found in Arusha region and in Kenya.
Image result for souvenirs arusha maasai blankets
There are so many souvenirs from Arusha region, ranging from the Maasai jewelry, to….
Image result for souvenirs arusha maasai blankets

Maasai blankets,..

Maasai scandels…

To woven baskets, pots and mats. You can never leave Arusha empty handed!!

Tanzanian peanut brittle traditionally sold by street vendors along with black coffee

And of cause, I cannot forget to mention the tasty Tanzanian snacks that can be found all over the country even in Arusha. The picture shows an example of such, known as ‘Kashata’ a snack made from peanuts and sugar.

I believe I should stop here for now, as I could go on and on! I recommend visiting this area. For anyone who would love to see the best of East Africa, Arusha is the place. Arusha and Zanzibar ( one of the islands on the Indian Ocean), which is just adjacent to Tanzania mainland. I was not able to visit Zanzibar this time around. Here’s one aerial shot while passing across the Island.

Image result for above view of zanzibar
Zanzibar…

Karibuni sana ( warmly welcome)!

Folic acid as a fortificant

Folic acid, is one among the forificants I will be assessing in my study of understanding how large-scale fortification impacts the environment . Yet how serious are folic acid deficiencies to humans? How successful has folic acid fortification been over the years? The clip below briefly explains:

SUN Business Network Quarterly Meeting

GAIN over the years has established several programs in the pursuit to eradicate malnutrition . One such unique movement (global movement) has been the Scaling Up Nutrition (SUN) program, founded on the principle that all people have a right to food and good nutrition. It joins people from the governments, civil society, donors, businesses , international organisations and researchers in a collective effort to improve nutrition .

In an effort to promote this movement , in 2012 the SUN Business Network (SBN) (a private sector branch) was launched to enhance business engagement. SBN strives to enable businesses, companies etc. to build a connected network that can expend the nutrition market, be able to contribute to a collective voice and community for nutrition in a particular country and to significantly provide into government policy decisions . The Sun Business Network assists countries to make their own country-led, multi-stakeholder approaches for scaling up nutrition with businesses and entrepreneurs.

Image result for scaling up nutrition (gain) sun business network
Global movement led by 61 countries

Last week Friday, I attended a SUN Business Network Quarterly Meeting organised by GAIN and WFP. It was quite interesting to listen, to stakeholders from all over the country bringing to the table in-depth discussions in relation to presentations given as well as sharing of various ideas through the session. Examples of businesses relevant and represented in this network include; companies linked to the food system like food producers, crop input suppliers , food processors & ingredient companies, food packaging producers, transporters, retailers etc. Those indirectly linked to the food systems include large-scale industrial producers eg exile or plastic companies, financial institutions as well as media and telecommunication companies. Below are a few pictures;

(Those seating), from left ; WFP country director , representative from the Prime Minister’s office, former director of the Food and Nutrition department at SUA, GAIN country representative . The rest are stakeholders that include businessmen, entrepreneurs, telecommunication companies etc who attended.
Presenter from Sahara Ventures presenting on ‘Trends in technologies to improve the efficiency of agricultural production and marketing ‘.


Presenter from Airtel (telecommunication company), presenting on ‘ Telecom solutions for small and medium enterprises (SME’s)’ .
Presenter from WFP presenting an interesting topic on ‘Use of technology in gathering food security and nutrition data via mobile vulnerability analysis and mapping (‘mVam)’.
A presentation on ‘Innovative technologies in agricultural value chains’.
‘Distinguished meeting facilitator’ and that would of cause be ‘me’!

Some of the key things noted through this session included;

  • Some of the recent trends in technologies to improve the efficiency of agricultural production and marketing in Tanzania has been through promoting value chain linkages through doing business through mobile phones, precision farming, food sensing technologies etc.
  • The utilization of technology in gathering food security and nutrition data using tools like the mobile vulnerability analysis and mapping (MVam) tool has shown great potential in Tanzania for easier collection of data . This involves the collection of food security and nutrition data using short mobile phone surveys and voice recognition technologies. The methods involved comprise of phone messages, live telephone calls and automated two-way communication systems.
  • Innovative technologies in agricultural value chains (a look at examples from different parts of Africa), that can also be implemented in Tanzania;
    • Creating approaches to help farmers afford inputs (high-quality fertilizers and seeds) by using a prepaid scratch card model,
    • Connecting farmers and tractor operators in the area by online and USSD (Short messaging services) platforms.
    • Enabling farmers to increase shelf-life and reduce losses of post-harvest grain using triple layer sealed plastic bags, cutting off the oxygen supply to create hermetic conditions.

That will be all for now, till next time…..

Kwaheri!!!

Life cycle assessment

As a part of my project, I will do a life-cycle assessment to analyse the impacts of large-scale fortification to the environment. The Msc.CCAFS coursework modules have been quite interesting , yet I must say the Life Cycle Analysis module was somewhat challenging for me. Despite this, I’m glad I’m using this tool in my project as now everything seems to be falling in place and the concepts make better sense. So here goes nothing…..!

Life cycle assessment, is an environmental management technique that considers all the aspects of resource utilization and environmental emissions associated with an industrial system from cradle to grave . This approach takes a holisitc view by assessing activities from the extraction of raw materials from the Earth, production, processing of product and distribution of energy as well as the use, and reuse, and final disposal of a product (Curan, 2008).

Related image
Life Cycle Assessment ‘Cradle to grave’ concept

The carbon footprints of such activities are measured to estimate the contribution of a particular activity to the environmental load. Carbon footprints compute the combined measure of CO2 and other greenhouse gases, emitted over the full life cycle of a process or product(Allen and Pentland, 2011) in a given time frame. This is described in the slide share below. The difference between an LCA and a Carbon footprint are related to the impact categories which are studied. A Carbon Footprint is focused on one environmental impact category: greenhouse gas emissions (CO2) whereas an LCA takes more impact categories into account, such as land use, water use and acidification.

The ‘Cradle-to- grave’ concept expresses the idea that every step of the product ‘s life cycle is included in the analysis allowing a comprehensive study of the product, highlighting more harmful stages than others (Baedeker et al., 2008 ) .Through this, the LCA approach enables mitigation strategies to be established to reduce the emissions concerned (Brodt et al., 2014) . These constitutive and unique features are what makes the LCA approach to have greater achievements compared to other environmental tools.

Shortcomings of LCA

Over time practitioners have learned the constraints of the LCA methodology.
Schenck and White, 2014, indicates the following;

  • System boundaries (scope of study) do vary in LCA studies even when they assess the same product system.
  • In a case where a material or input process in a LCA creates multiple products, a precise analysis is required to describe the environmental impact of the different products (time-consuming and costly).
  • The accuracy of environmental data, Life-Cycle Impact assessment methods, as well as the wide range of decisions involved, do increase uncertainty of the LCA
    results having major effects on the accuracy of the study. These aspects necessitate to clearly documenting the system boundary, the allocation method and the uncertainty assessment when reporting LCA results.
  • Some environmental data are scarce to find (Andersson , 2012).

Stages of Life-Cycle Assessment

The ISO 14040:2006 describes the principle stages and framework for Life Cycle Assessment including;

Stage 1: Goal and scope;  targets to define how the  product life cycle will be taken in assessment and to what end will assessment be serving. The criteria serving to system comparison and specific times are described in this step (Krishna et al., 2017).

Stage 2: Inventory analysis gives a illustration/description of material and energy flows within the product system and specifically associates its interaction with environment including consumed raw materials, and emissions to the environment (Krishna et al., 2017).

Stage 3: Impact assessment; details from inventory analysis are used to analyse the impact. The indicator results of all impact categories are detailed in this step; the importance of every impact category is assessed by normalization and eventually also by weighting (Krishna et al., 2017)

Stage 4: Interpretation of a life cycle involves critical review, determination of data sensitivity, and result presentation (Krishna et al., 2017)

Four stages of LCA under the ISO 14040 guidelines:

(Krishna et al., 2017)

And how can LCA be applied?

The diagram below describes examples of how the LCA interpreted results can be utilized in various sectors;

Image result for life cycle assessment
(Blonk Consultants for environment, sustainability, nutrition and health)

That will be all for now.

Cheers!

First week with GAIN

I began my placement with GAIN Tanzania this week. Here I met my co-supervisor, Mr Edwin Josiah, who is the African representative for GAIN premix facility plus fellow colleagues who all gave me a pleasant welcome . We have begun work already, and I do believe I’m in good hands.

Image result for global alliance for improved nutrition
The goal is to advance nutrition outcomes by improving the consumption of nutritious and safe food for all people..

Why fortify foods?

Hey everyone!

I found an interesting review involving global mapping of Food fortification for the year 2016 . Below are some insightful points on why fortification of certain foods is significant to populations.

The deficiencies of important vitamins and minerals (also known as ‘hidden hunger’) have brought on significant public health problems globally. This has been a worse case, specifically for low and middle-income countries. Major prevalent micro-nutrient deficiencies (MNDs) include that of iron and vitamin A deficiencies.

According to Bailey et al., 2015 , an estimated 0.8 million annual deaths worldwide are linked to iron deficiency and 40-60% of children between the age group of 6-24 months are vulnerable in low and middle-income countries. Vitamin A deficiency is a primary cause of childhood morbidity and mortality, been a leading cause of preventable blindness in children affecting 250-500 million children worldwide.

Micro-nutrient deficiencies scarcely occurs in isolation, whereby multiple MNDs usually occur concurrently majorly driven by a lack of food security and dietary diversity. Generally, MNDs are widespread as shown in the fig 1 below, with significant health and economic consequences where economic losses in low and middle income countries approximately range from 2-5% of gross domestic product.

Fig 1; Map describing the magnitude of micronutrient deficiencies globally (Hoogendoom et al., 2017)

It is unfortunate that , as studies show, the cycle of micro-nutrient inadequacies continue across the life span as described in the fig 2 below.

Fig 2; The conceptual framework for the cycle of micro-nutrient inadequacies across the life span (ACC/SCN: Fourth Report ,2010)

The three major complementary approaches to optimizing nutrient intake among communities has been to enhancing dietary diversification, supplementation and food fortification(Fleischhacker, 2019). While consumption of a diverse diet is the primary long-term goal ideal, it is far from been a daily reality for many people due to combination of limited access (availability and affordability) of diverse foods (Garrett and Haddad, 2017). Supplementation, while essential for treatment of deficiencies where they exist and prevention of deficiencies where groups in the community may be vulnerable (example; pregnant women and children of under-five years of age)(Beal et al., 2017), such programmes are expensive to implement universally (Garrett and Haddad, 2017). Food fortification, involving the enrichment of micro-nutrient in staple foods commonly consumed by populations has proven to be a more sustainable and effective approach to improving the health and well-being of large numbers of vulnerable people(Beal et al., 2017)

Over the years, food fortification has proven to be advantageous as it requires less change in consumer food habits and behaviors than other nutrition-based interventions and is likely more cost-effective (Osendarp et al., 2018, Bishai and Nalubola, 2002)

Nora