Hunger and malnutrition – are both felt and feared by many globally. With the recent mumbles of rising energy, food and essential commodity prices, ensuring that food systems can deliver the right produce, to the right people, at the right time, in a manner that promotes healthy people, and a healthy planet is critical.
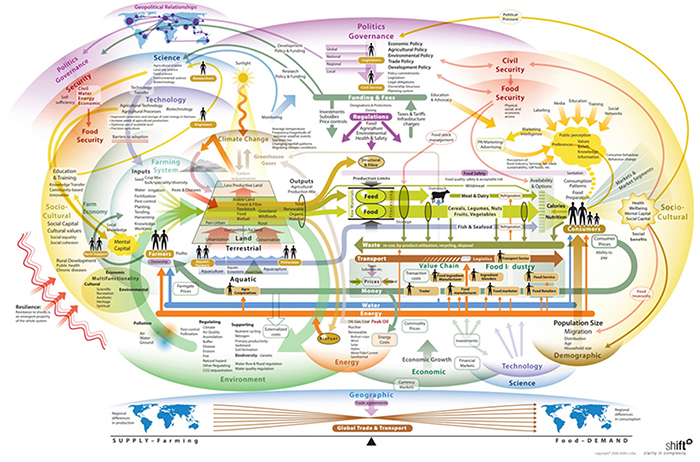
Therefore, the exploration of urban food systems and their performance requires a holistic approach that can account for the plethora of actors and factors that shape the system and their interactions as well as their outcomes and impacts. One of the proposed methods is ‘food mapping’.
Food system mapping aims to identify all of the stakeholders, institutions, goods and activities (including waste), their flow and policy, economic and environmental setting, to record the “status quo” of the food system. While mapping provides a static depiction of the basic structure and a framework to guide systematic analysis and other important areas such as food safety and pathogen flows (Kiambi, Alarcon et al. 2018), time course based food mapping can reveal rates of change and dynamics in food systems.
As food is a cross-sectoral, multidisciplinary subject that intersects with a wide range of urban issues, mapping can produce rich visual displays of geospatial and other data to enable decision making. Mapping can also be participatory involving stakeholders across the food system (e.g. citizen science and crowdsourcing approaches), and expose hidden disparities, strengths and weaknesses within the food system.
So, how can one conduct a spot of food mapping if they feel so inclined? In the past decade, GIS (geographic information systems)-based mapping software, and more recently used in combination with methodologies that favour qualitative engagement (such as surveys, focus groups, transect walks, or stakeholder meetings) has been one of the most frequently used approaches to mapping urban food systems.
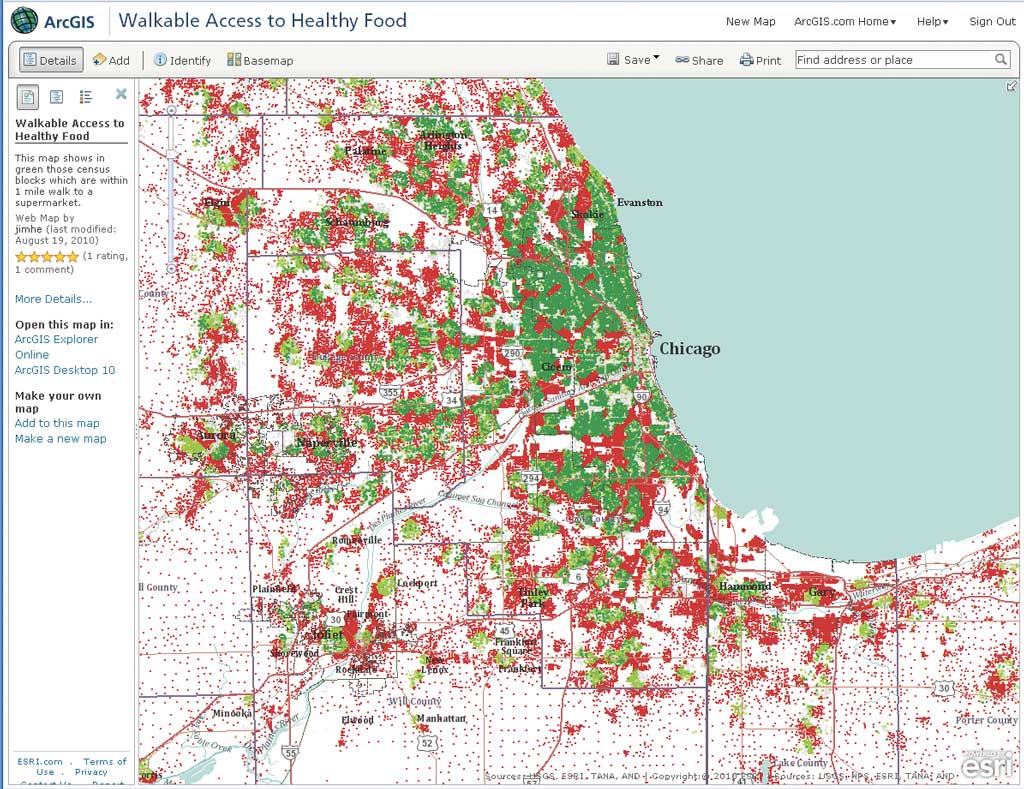
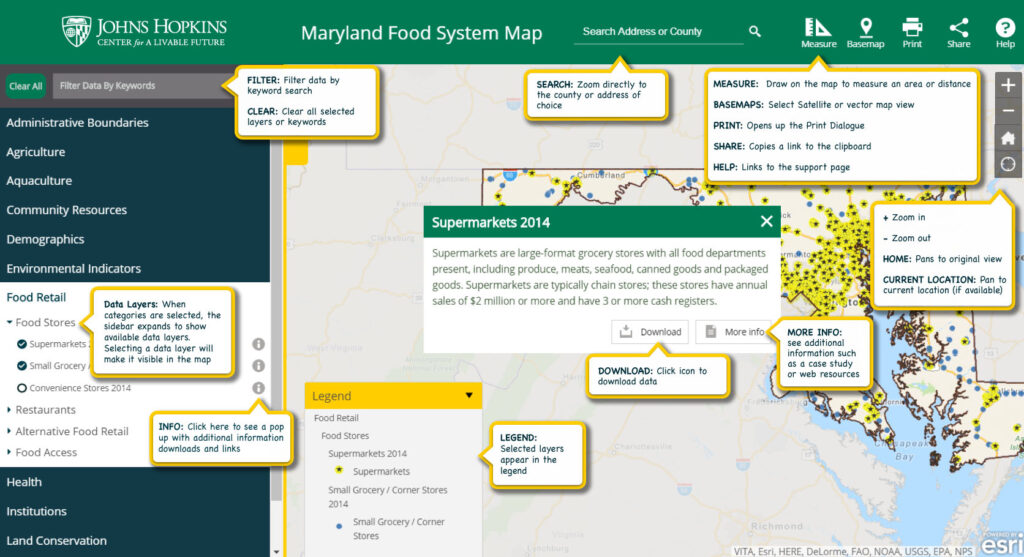
However, in addition to geo-spatial approaches there are also spatial analysis and visualisation including internet-based tools such as Google Earth, ArcGIS Storymaps and Maryland Food Systems Map and guides including FAO’s City-Region Food System (CRFS) programme.
In brief, GIS-based mapping of food systems is perhaps the most frequently used approach, especially within the realms of food access, food justice and food security (Sweeney et al., 2016). For example, Kremer & DeLiberty, (2011) utilised a combination of GIS and remote-sensing technology to determine the amount of Philadelphia’s land area that could be devoted to food production, along with the incorporation of interviews and demographic data to determine the structure of the current local food system of Philadelphia. The maps also illustrated the locations of farmers’ markets and gardens throughout the city, which if properly disseminated could be a valuable resource to residents and policymakers.
More recently in Leeds, Jensen & Orfila (2021) produced a spatial map and assessment by using publicly available datasets, whose content was elevated by expert local stakeholders, and inter-related relevant indicators relating to diet, public health and food production, to import into GIS.
However, following concerns that GIS-based food mapping produces a static snapshot and fails to capture the dynamic nature of the food system and the people embedded within it, came the rise in popularity of the use of participatory GIS (PGIS)-based food mapping to incorporate methodologies that favour qualitative engagement such as surveying, focus groups, community mapping exercises and the use of mobile phone applications.
PGIS-based food mapping offers community members the opportunity to incorporate their own knowledge and observations, allowing the mapping exercise to better reflect both the temporal and spatial qualities of the food system. The rise of crowd-sourced mapping movements with the proliferation of computing technology, particularly handheld devices, has encouraged the growth of PGIS-based mapping approaches.
Examples include the work of Ahemed et al., (2019) which explored the geography of foodscapes in low-income settlements in Nairobi using PGIS tools, including food mapping with mobile apps and high-resolution community aerial views with balloon mapping to capture and contextualise local knowledge and challenges. In addition, Terdoo & Feola (2020) developed a novel rapid participatory system mapping method to elicit system conceptualisations from distinct value chain actors, such as rice, to potentially boost the resilience of agri-food systems in Benue State, Nigeria.
As a result of the varying areas of research that choose to generate food systems maps, there are of course varying audiences with different terminology, interests and angles. Internet-based tools to map urban food systems provide the unique opportunity of offering accessible, user-friendly, interactive maps that can include glossaries, features that allow the user to zoom in and out of defined areas of interest, offer pop-ups with more detailed information, links to additional resources.
Furthermore, most interactive internet-based tools possess the ability to select layers allowing the user to view only the information they are seeking, thus bypassing information-dense maps that are more difficult to decipher and encourage the empowerment of community members to better understand their local food environment.
I truly admire the diversity of food mapping approaches being currently practiced. Although the area of food mapping is still relatively new, the future of food mapping is very exciting as it has already become highly inclusive and comprehensive over the past few years. Another major strength of food mapping is its accessibility – internet-based mapping tools can facilitate community-level food mapping, how exciting!
References:
Ahmed, S., Haklay, M., Tacoli, C., Githiri, G., Dávila, J. D., Allen, A., & Fèvre, E. M. (2019). Participatory mapping and food‐centred justice in informal settlements in Nairobi, Kenya. Geo: Geography and Environment, 6(1), e00077.
Jensen, P. D., & Orfila, C. (2021). Mapping the production-consumption gap of an urban food system: an empirical case study of food security and resilience. Food security, 13(3), 551-570.
Kiambi, S., Alarcon, P., Rushton, J., Murungi, M. K., Muinde, P., Akoko, J., … & Fèvre, E. M. (2018). Mapping Nairobi’s dairy food system: An essential analysis for policy, industry and research. Agricultural systems, 167, 47-60.
Kremer, P., & DeLiberty, T. L. (2011). Local food practices and growing potential: Mapping the case of Philadelphia. Applied Geography, 31(4), 1252-1261.
Sweeney, G., Hand, M., Kaiser, M., Clark, J. K., Rogers, C., & Spees, C. (2016). The state of food mapping: Academic literature since 2008 and review of online GIS-based food mapping resources. Journal of Planning Literature, 31(2), 123-219.
Terdoo, F., & Feola, G. (2021). Rapid participatory system mapping builds agri-food system resilience: evidence from Nigeria. African Geographical Review, 40(1), 63-75.