Sunday the 25th of August I could finally say I had completed my thesis and there was no going back. What a year it has been, returning to college, meeting great people and getting the chance to travel. There is too many people to mention in my acknowledgements but off the top of my head I would like to thank Professor Charles Spillane, Dr Peter McKeown, Dr Gina Pighetti and Collin McCorkel both from University of Tennessee.
Warm season forages can provide favourable forage yields and have similar mineral/nutritional value as cool season forages. The inclusion of warm season forages into pasture can be beneficial as it can extend the grazing season without sacrificing pastures. From the data available it is fair to say while warm season forages didn’t greatly increase Ca, Mg, P and K levels, it did however remain within the same level as cool season forages. This maybe be due to the fact temperature was becoming milder and rainfall was increasing, warm season crops didn’t improve mineral content as one may have expected. Fluctuations in minerals were statistical significant difference mixture and mixture*month which could be due to environmental conditions, season, maturity or forage specie. The pastures tested had almost adequate levels of minerals for grazing ruminants.
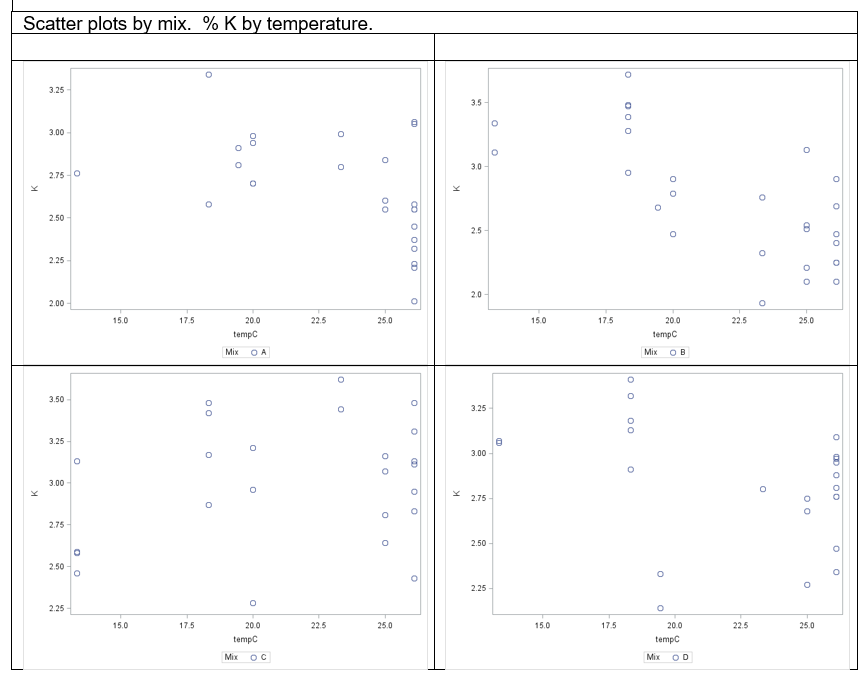
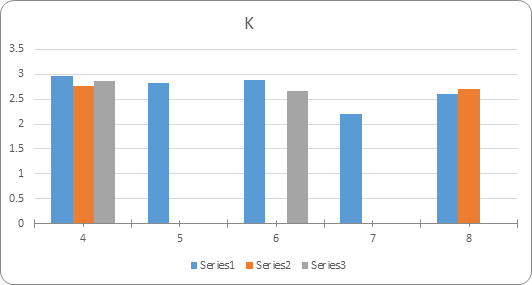
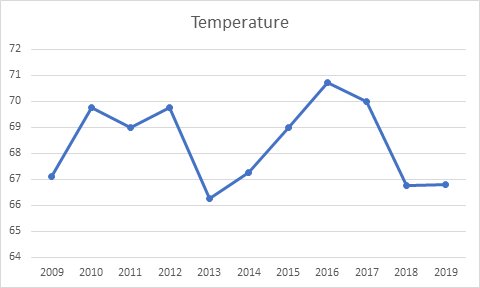
The above scatter plot indicates the relationship between temperature and potassium. In the range between 17.5 and 20 degrees highest levels of K are found, however below 12 degrees and above 22.5 degrees, K levels drop greatly. Potassium levels from April (4) to August (8) and over each of the 3 years, Blue (2017), Orange (2018), Grey (2019). As stated there little fluctuation between each year and month10 year temperature data. General overview the temperature follows a cyclical pattern, reaching lowest temperature in 2013, highest in 2016 and low again in 2019.
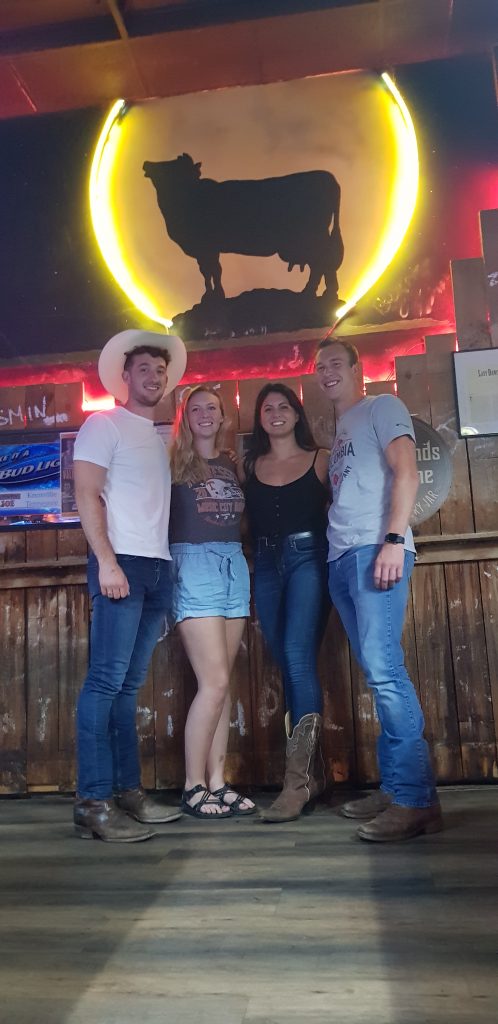
Words and photos cannot describe how much of a culture shock but yet an unbelievable experience it was for me to attend the local Cotton Eyed Joe. Every Sunday locals from all ages would attend this line dancing event to get fit or have a good time.
The weekend of July 27th to the 31st I got the chance to hop on a plane and travel to the big apple, New York. This was a welcome break for me as I was going to visit friends from home who are living in New York and also a few friends who travelled down from Canada. It was an experience I will never forget and a massive change from Knoxville. I got to experience the busy life in New York, also taking a day trip to Long Beach.
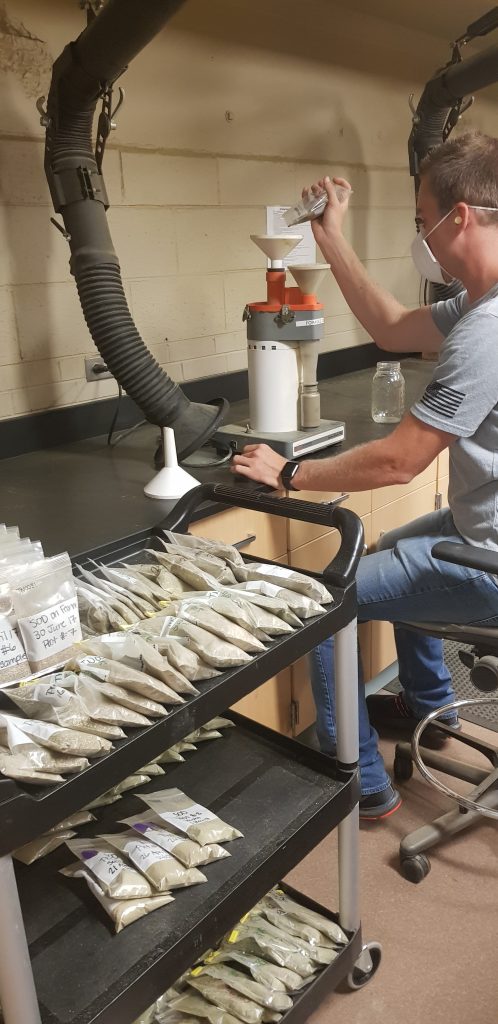
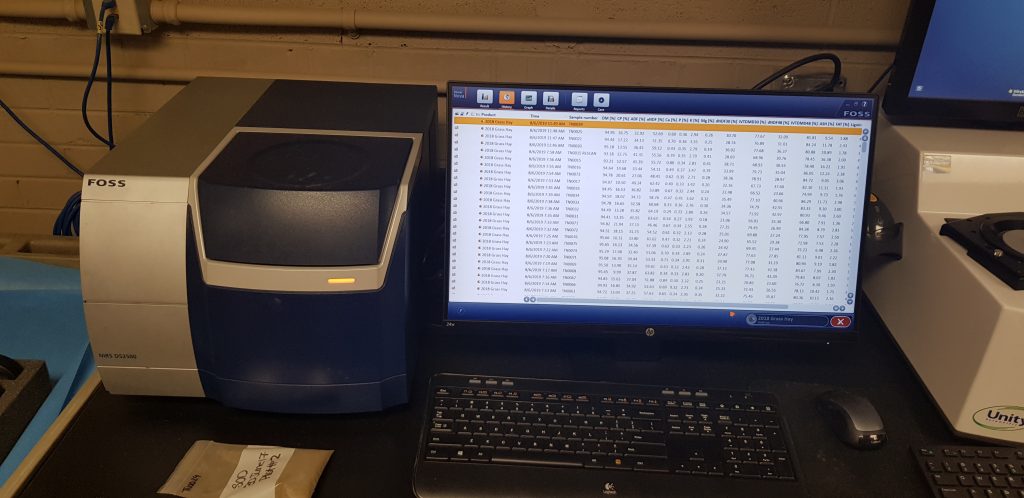
In the past number of days there has been changes made to my original thesis which was out of my control, however the goal is the same. Now I solely focus on the one farm in Tennessee. In the last number of days all the 2017 and 2018 data needed to be re-run through a cyclone mill to grind forages to the correct size. Once completed, samples were then tested for mineral composition using a FOSS NIRSDS2500. Currently I am in the process of completing 2019 data.
Data ready for re-testing. Data was placed in ovens for one and half hours before testingData was passed into a cyclone mill. This further broke-down data to a finer size. It was stored in a bottle then placed back into labelled bags.Data ready to run through NIRSDish containing data placed in NIRS2500Over-view of the system
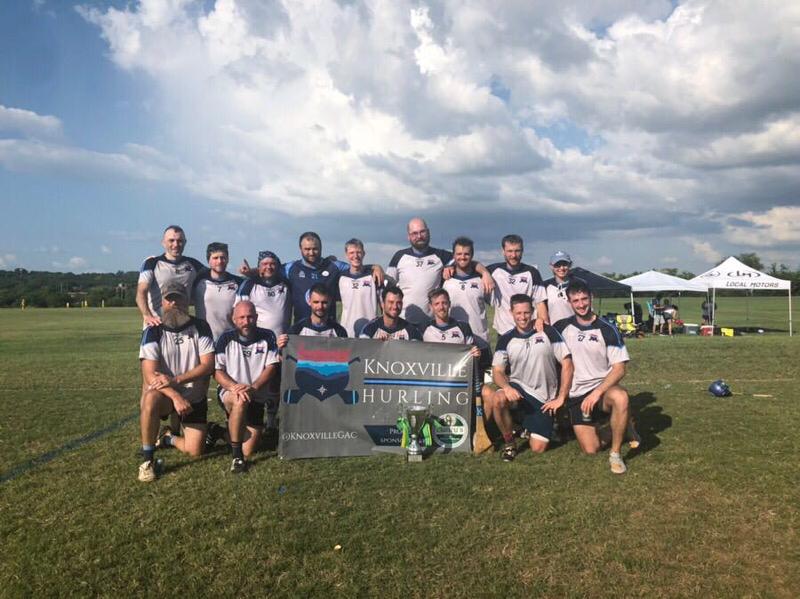
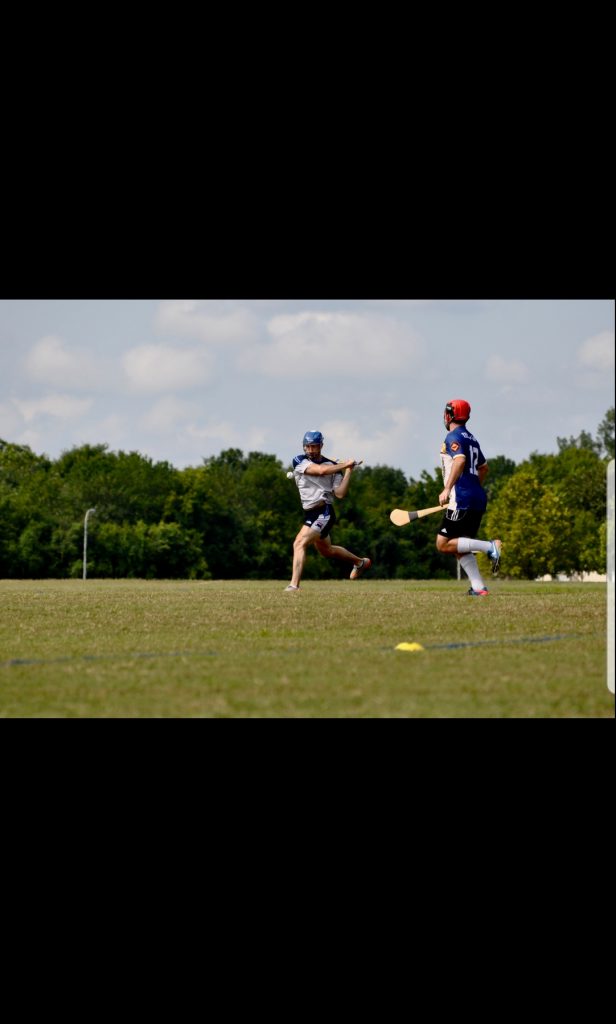
Since arriving in Knoxville the hurling club have really welcomed me with open arms and made me feel at home. The weekend of July the 20th the team travelled to Nashville to compete in the Music City Invitational Championship. After playing a number of games in 85+ F temperatures, Knoxville won their first major title. This experience gave me great opportunities to meet people, travel and play the game I most enjoy.
The winning teamWith the clubs chairmanRunning home with the ballNo stopping that
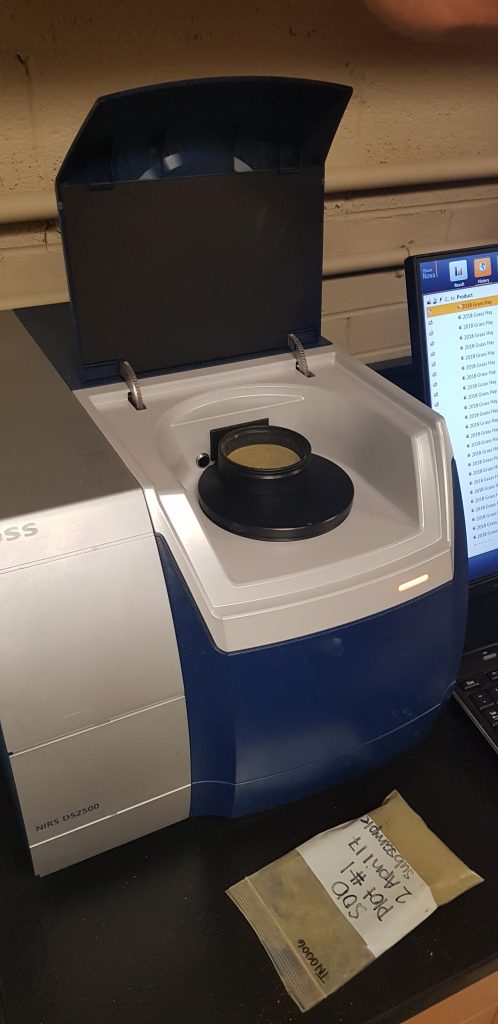
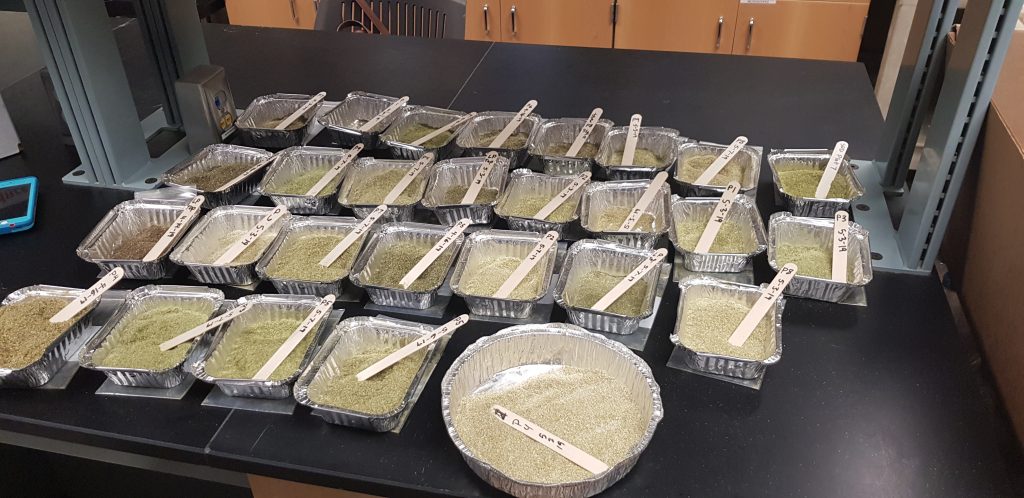
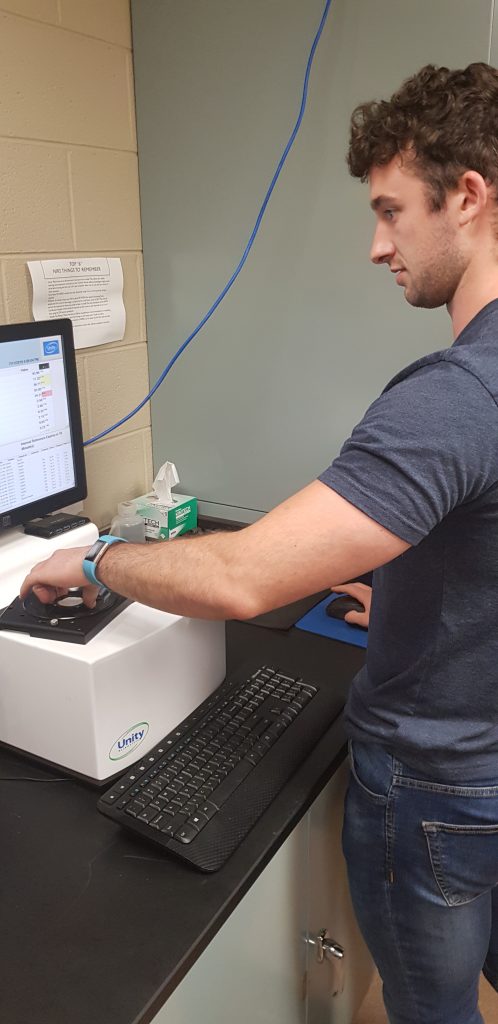
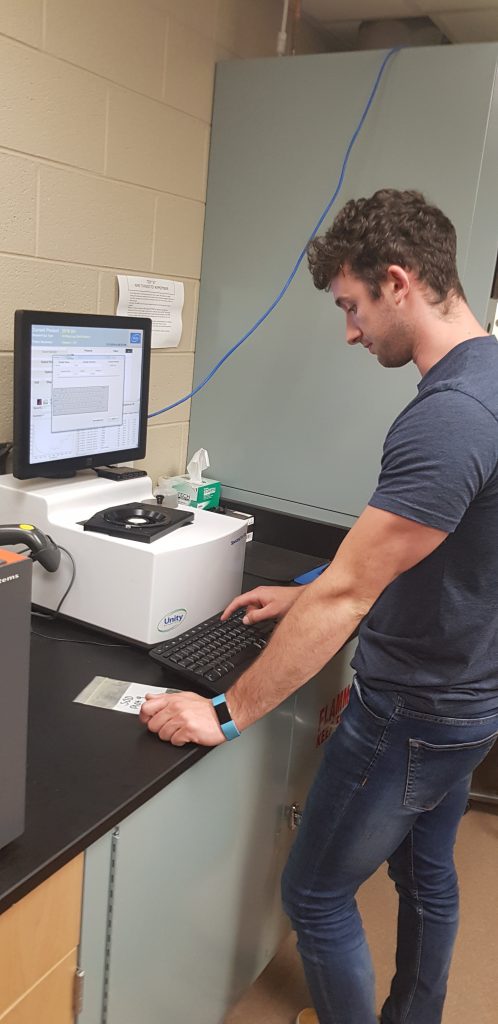
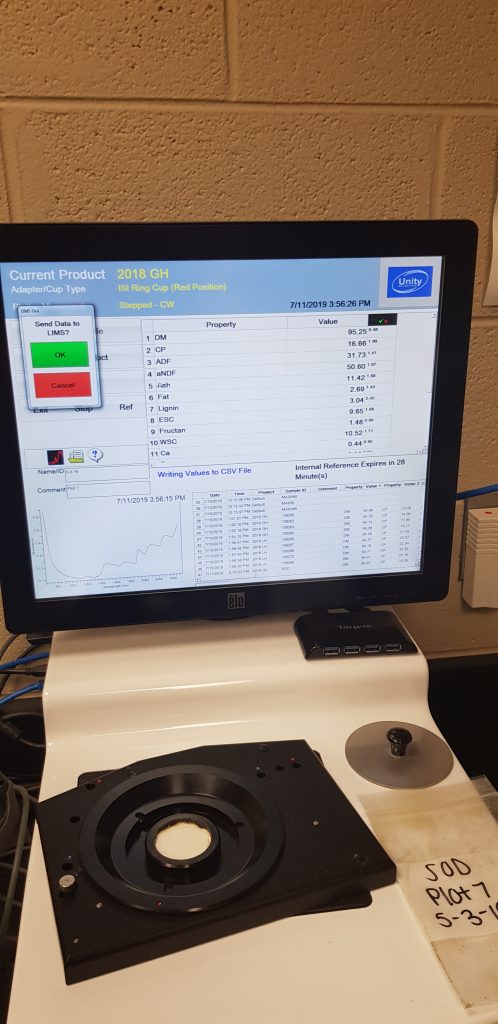
Once grinding is completed, samples are ready for NIRS sampling. The sampling process is carried out in the following steps. 1 – forage sample is placed into the sample plate and sealed in (make sure not to touch the glass) 2 – Place sample plate on NIRS equipment 3 – Enter in plot number, date and initials to the system and run test 4 – After 30 seconds a report is generated containing information of mineral content
All forages plated and ready for sampling Placing forage into sample plate and sealingPlacing sample plate on NIRS equipment Entering plot number, date and initials to the system Final report which gives you nutritional and mineral information
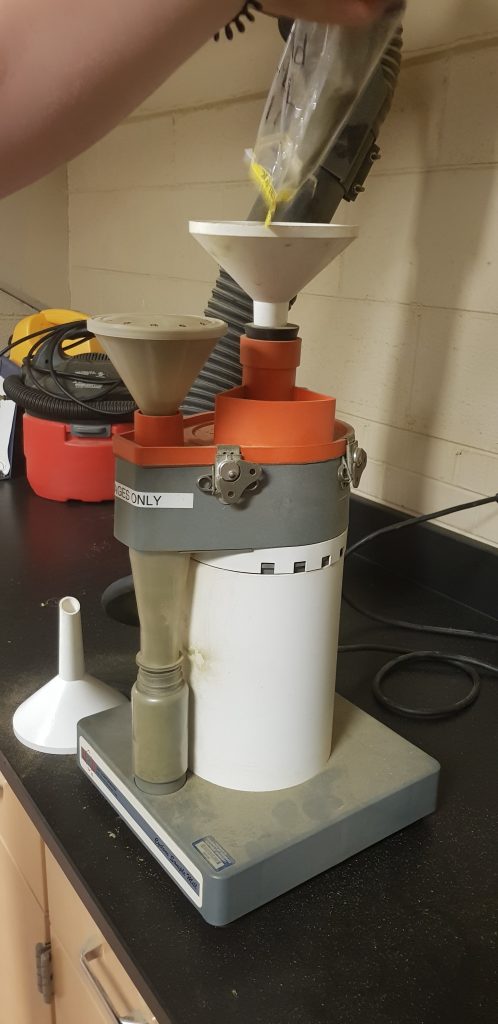
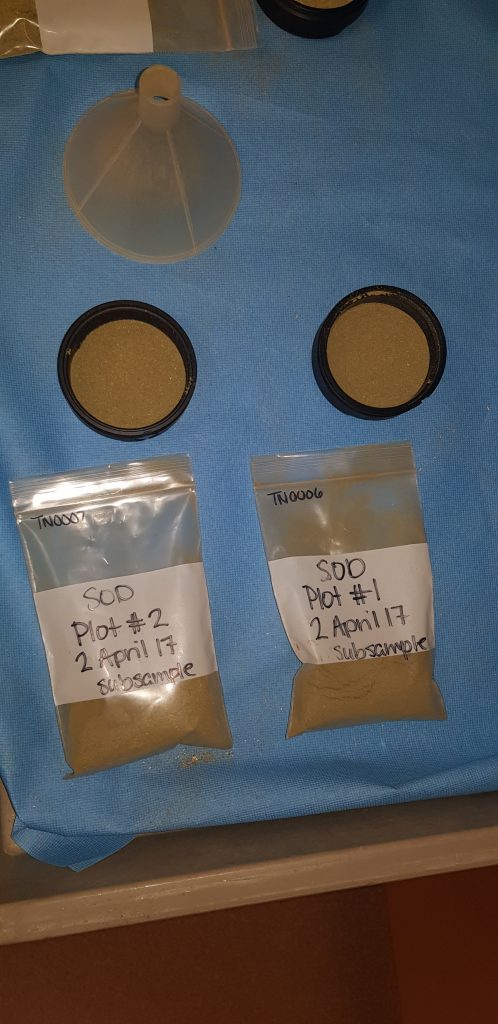
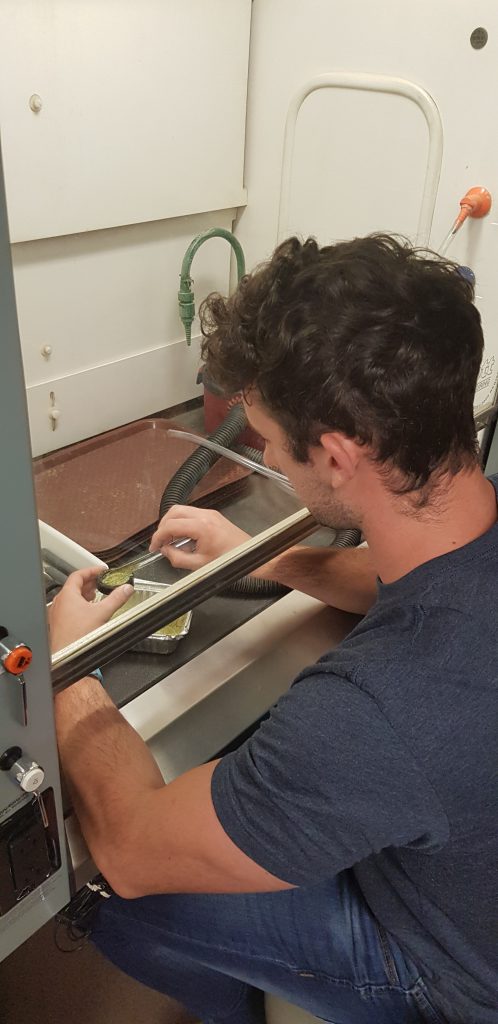
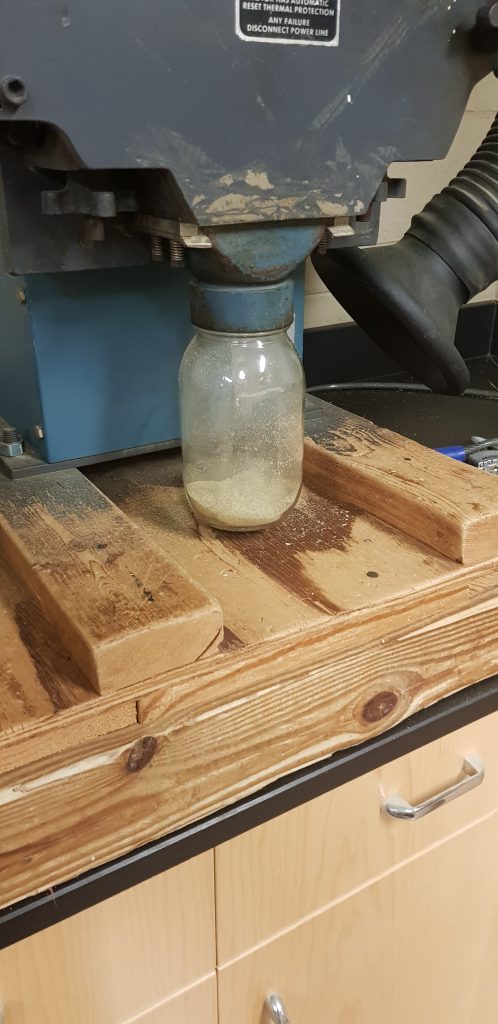
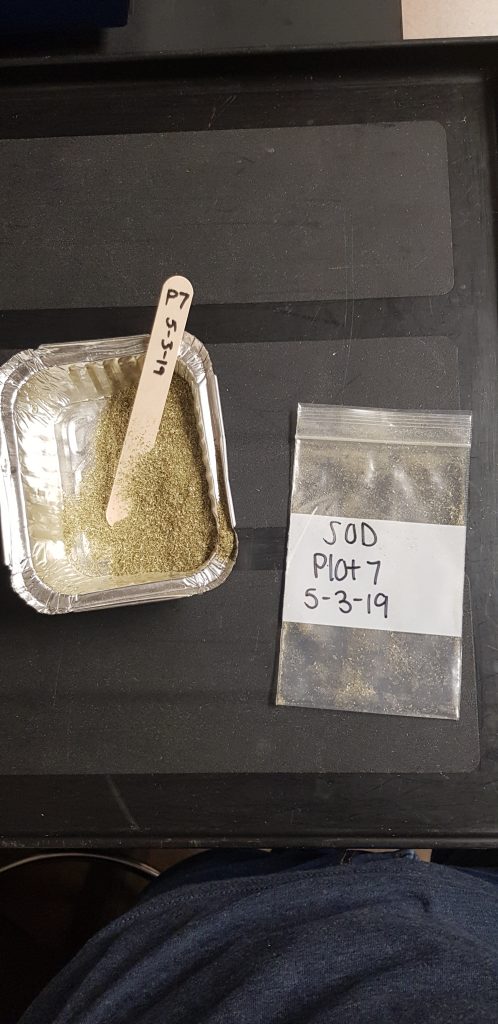
Once forages were sorted it was time to grind the samples into tiny particles. In the laboratory forages were placed into a grinding machine and the placed into individual bags .
Process of grinding forages. Once grinding was complete, forages were stored in individual bags and labelled
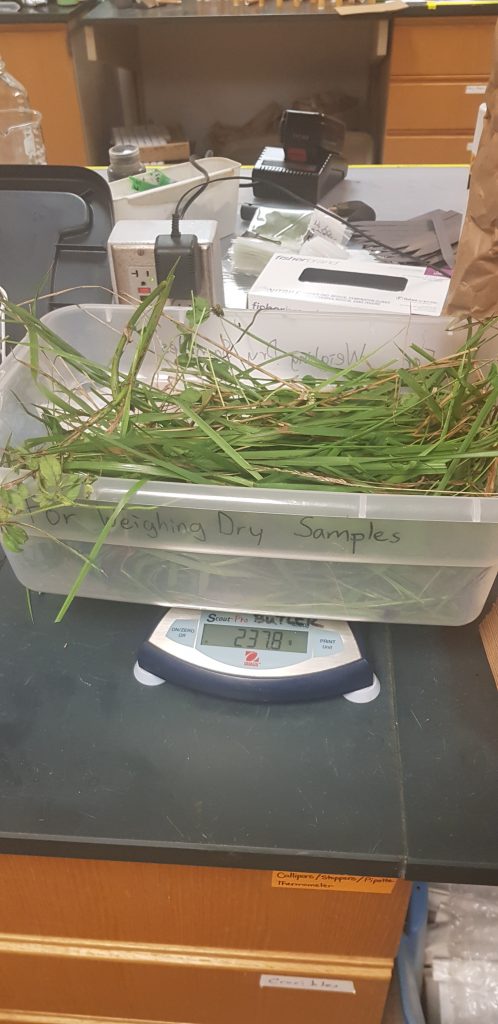
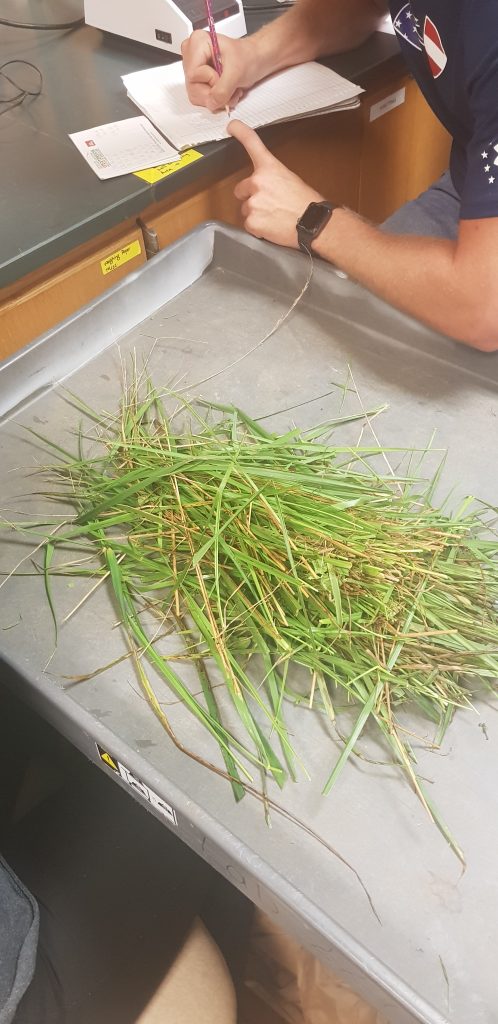
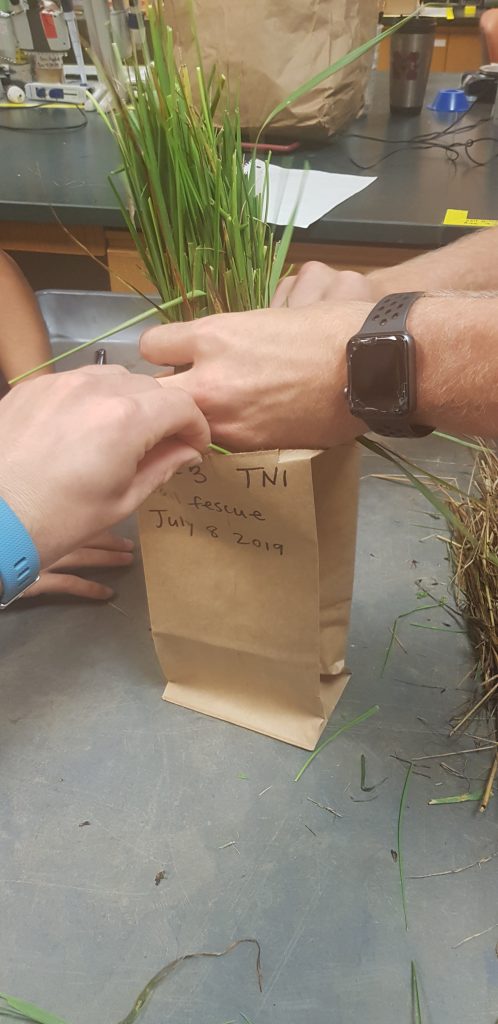
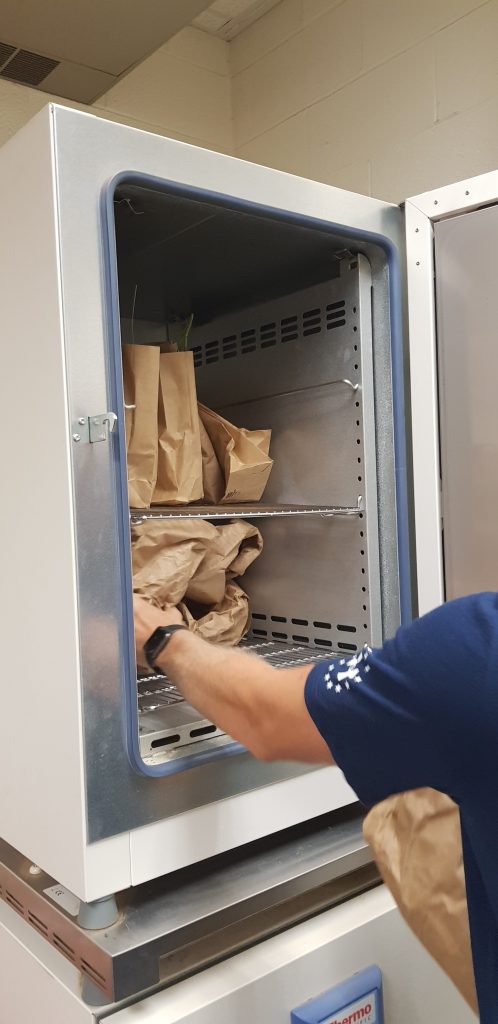
Today I was in the forage laboratory sorting and preparing forages by the farm ID and grass mixture. 1 – Forage was placed on a a scale and weight was taken 2 – Roughly half of this was then removed and placed into its original bag 3 – The remaining half was then separated in accordance to the plot it was taken from and the mixture sown in the plot. 4 – If the mixture was specifically tall fescue and red clover only them species were collected and placed in individual bags and labelled ‘tall fescue’ and ‘red clover’. Any other forage species within the mixture were placed in one bag and labelled ‘weeds’. 5 – All bags were then placed in incubators at 45 degrees for 48 hours. In the coming days these forages will be grinded and results obtained.
Weighing forage samples Separating the forages required and not required Placing required forages in labelled bags Placing all bags in incubators at 45 degrees for 48 hours