As part of my research project, I reviewed the methods used to measure adaptive capacity and how this can be used to develop targeted CSA programmes. More information on my research project can be found here.
Climate-smart agriculture (CSA) aims to integrate agricultural development and climate responsiveness, through its objectives to sustainably increase productivity, improve resilience or adaptive capacity, and mitigation (FAO, 2010, Nguyen et al., 2017, Rosenstock et al., 2016). With the impacts of climate change likely to increase risks of agricultural losses, CSA has been promoted as a means to spread this risk and improve food security, which is especially important for those who are furthest behind or most marginalised (Rosenstock et al., 2016, FAO, 2010). Climate change, including changing temperatures, precipitation patterns, and frequency and intensity of extreme events, will likely result in altered pest and disease patterns, damaged infrastructure and natural resources, and difficulties with crop and livestock production (FAO, 2010, Lan et al., 2016). Improved practices and technologies can have an important impact on global food security. One important benefit of CSA programmes is improving the food security of women farmers, as women tend to spend more time on food preparation and feeding, meaning time-saving practices within CSA programmes can reduce their work burden and energy spent on other tasks (Murray et al., 2016). Despite the benefits of CSA, barriers to scaling out programmes prevent its widespread adoption, leaving individuals and households at risk of climate change impacts and agricultural losses.
To develop a successful CSA programme, the barriers of CSA adoption must be overcome. Barriers to the adoption of CSA can be hardware or software barriers, including financial, institutional, knowledge and informational, psychological and cultural, and technical barriers (Giles et al., 2021, Barnard et al., 2015). Financial barriers include lack of access to credit or high installation costs (Nguyen et al., 2017). These barriers can be linked to institutional and technical barriers, with investment into researching data gaps or funding for initial costs of adoption necessary for successful implementation of CSA programmes (FAO, 2010, Lan et al., 2016). Barriers to the uptake of CSA directly relate to the determinants of adaptive capacity as discussed by Adger et al. (2007), Smit et al. (2001), and Yohe and Tol (2002). Through understanding and measuring these determinants before adaptation occurs, the groups and individuals that face barriers to adaptation and the barriers affecting their ability to adapt can be better understood. The determinants of adaptive capacity consist of a range of socioeconomic factors which, when enhanced, can enable individuals and groups to adapt their practices and technologies to build resilience to the impacts of climate change. Determining adaptive capacity can enable the measurement of those most vulnerable to climate change impacts and therefore, those most in need of adaptation strategies. The IPCC vulnerability framework considers vulnerability as a function of exposure, sensitivity, and adaptive capacity, and can be used to determine those most vulnerable to climate change (De Sherbinin et al., 2019).
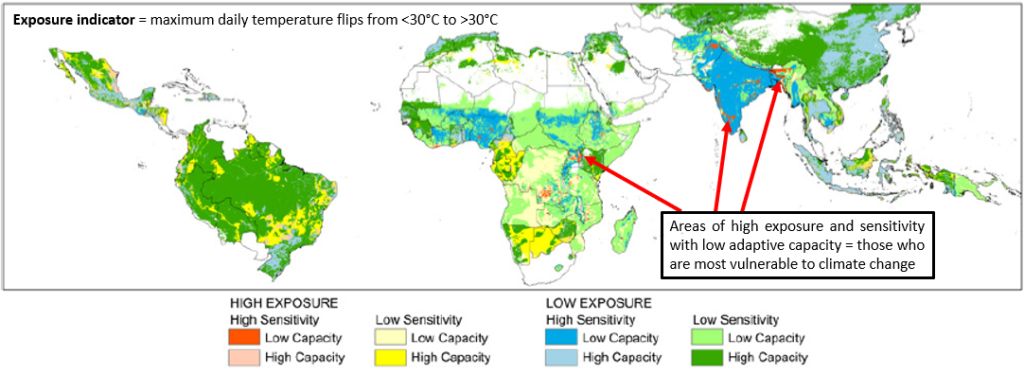
Climate vulnerability mapping studies use the IPCC framework for vulnerability to determine those most vulnerable to climate change using measurements on exposure, sensitivity, and adaptive capacity. CSA programmes can more effectively target adaptation strategies to those most in need of them when an understanding of those who are vulnerable to climate change exists. Climate vulnerability mapping can spatially identify locations where adaptation responses need to be targeted and programmes need to be tailored to overcome any barriers those with low adaptive capacity may face. Ericksen et al. (2011) discusses that those who are most vulnerable exist where exposure and sensitivity are high, while adaptive capacity remains low as can be seen in Figure 1.
However, issues with data availability can impact the effectiveness of climate vulnerability studies. To understand where those most vulnerable to climate change are located, data which covers a wide range of socioeconomic factors is needed at a usable scale (e.g., household or community level). Collection and analysis of data at this depth can be expensive and time consuming (Ericksen et al., 2011), requiring large-scale investments by governments. With sufficient investment, climate vulnerability mapping can be an effective tool to understand where CSA is most needed, with the measurement of adaptive capacity in these studies enabling CSA programmes to overcome barriers.
The references used in this post can be found on the bibliography page here.