As part of my research project, I will use climate vulnerability mapping to determine the rural communities and households which are most marginalised and vulnerable. More information on my research project can be found here.
Leave no one behind (LNOB) is one of the guiding principles of the United Nations Sustainable Development Goals (SDGs) which aims to prioritise and fast-track actions which benefit the poorest and most marginalised people (Stuart and Samman, 2017). The LNOB agenda ensures all inequalities, especially non-income based inequalities will be tackled by governments; however, this agenda requires the development of improved data to identify marginalised people, as well as tools to communicate this data to decision makers (Stuart and Woodroffe, 2016). Vulnerability mapping can be used to communicate this data, directing the attention of decision makers to geographic areas where the impacts on society will be greatest and where it may be necessary to develop interventions and adaptation strategies (De Sherbinin et al., 2019). This will be especially important to understand the impacts of climate change, which is likely to most affect vulnerable populations who are unable to adapt to climate change impacts.
LNOB is an especially important concept in developing countries, such as Vietnam, where poverty decline has slowed. Economic growth in the 1980s and 1990s greatly reduced poverty in Vietnam, which was considered an extremely poor country at the time (Dollar, 2002). Policy initiatives by the Government of Vietnam, including the National Target Programme on Sustainable Poverty Reduction, have clear aims to meet the first SDG goal to end poverty throughout the country (Government of Vietnam, 2018). Lanjouw et al. (2017) has found poverty rates in Vietnam have become more spatially concentrated over time, with the Northern mountain regions having the highest poverty rates, with 95% of Vietnam’s poor living in rural areas. Poverty is also found to affect those from marginalised groups most, such as ethnic minority groups, which account for 15% of Vietnams population, but half the country’s poor, and three-quarters of the extreme poor (Nguyen T et al., 2017). It is essential that the factors affecting poverty are better understood and the locations of those living in poverty, and therefore vulnerable to the impacts of climate change, is established.
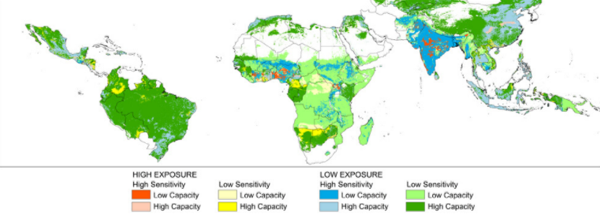
Climate vulnerability mapping leads to a better understanding of how climate change and other socioeconomic factors impact the vulnerability of people and their adaptive capacity to cope with these impacts. Most climate vulnerability mapping studies follow the IPCC framework on vulnerability which measures vulnerability as a function of exposure, sensitivity, and adaptive capacity (De Sherbinin et al., 2019, Lan et al., 2016, Ericksen et al., 2011). Hotspots for vulnerability tend to be found where areas of high exposure and high sensitivity coincide with areas of low adaptive capacity, however these areas can vary spatially depending on the indicators used (Ericksen et al., 2011, Khan et al., 2021). Vulnerability maps can provide a visual representation of data which can enable adaptation among marginalised communities, while also indicating where high barriers to adaptation may exist (De Sherbinin et al., 2019). This information can be used to develop interventions which can build the resilience of vulnerable populations to the impacts of climate change.
Climate vulnerability maps are an effective tool to communicate climate and socioeconomic risks to many key stakeholders, including policy makers. The data presented in these maps can have many uses, including contributing towards investment decisions, prioritization of actions, and advocacy (UNDP, 2010). Understanding the location of marginalised populations can prioritize policy actions to enable the development of effective, targeted policies. For instance, areas with low adaptive capacity may be facing barriers to adoption of new technologies, such as policy and institution, funding, research, training, and technical capacity barriers, as well as socioeconomic factors which may prevent uptake of new technologies (Lan et al., 2016). For climate vulnerability maps to be an effective tool, limitations from previous studies must be overcome. These include the characterization of uncertainty, improving readability of maps for multiple audiences and following mapping conventions, and effective engagement with policy audiences (De Sherbinin et al., 2019). Ensuring vulnerability maps can be useful in policy makes the information gained in these studies valuable and relevant to the LNOB agenda.
The 2030 SDG agenda which follows the principles of LNOB requires the development of data and tools which can determine the location of marginalised people and vulnerable people and the reasons behind their vulnerability. Marginalised groups in Vietnam are more likely to live in poverty, reducing their adaptive capacity and resilience to the impacts of climate change. Climate vulnerability mapping is a useful tool which can communicate information on the location of these groups and enable the development of policies which support vulnerable communities and individuals. This tool can also develop an understanding of the constraints and barriers faced by vulnerable people, allowing for the development of effective and targeted policies which can help to build the adaptive capacity in these areas and reduce the vulnerability.
The references for this post can be found in the bibliography here.