Carbon Navigator
The carbon navigator was established to assist in the task of reducing carbon emissions in the dairy and beef sectors of agriculture in Ireland. The carbon navigator is a knowledge transfer (KT) tool, intended to be of help at farm level, in determining possible mitigation options and communicating well with the farmer (Murphy, Crosson et al. 2013). It is designed to inform farmers of practices in which they can adopt and ways in which to improve performance, in order to both reduce emissions, and also increase profitability. It is important to note that, the Carbon Navigator does not account for all GHG emissions associated with a farm (Murphy, Crosson et al. 2013). The Carbon Navigator is a learning tool for farmers, and therefore intended to keep the interest of farmers, and to inform them on how to reduce their emissions outputs.
So why do we need a carbon navigator? Food Harvest 2020, the sectoral development plan for Irish agriculture, recommends growth in output over the coming years (Murphy, Crosson et al. 2013)and (Department of Agriculture Fisheries and Food, 2010). Of this, there is to be a 50% increase in dairy output (the milk quotas were abolished in 2015), and a 20% increase in the value of beef (Murphy, Crosson et al. 2013). However, at the same time in which we are to be increasing our beef and dairy outputs, we are also meant to be reducing our greenhouse gas emissions, as outlined by Food Harvest 2020 (Department of Agriculture Fisheries and Food, 2010). Ireland has pledged to reduce its non-emissions-traded sectors GHG emissions by 20% by 2020. If we want to achieve both these objectives, then we need a way in which to achieve greenhouse gas reductions at farm level. This is why the Carbon Navigator is so important. It is a decision support tool that can help farmers improve productivity, while at the same time improve carbon efficiency, and thus, increase income as well (Murphy, Crosson et al. 2013).
Ireland’s anthropogenic greenhouse gas emissions from agriculture are high, at about 29-30%, compared to the global average, which is around 13.5% (Pachauri and Reisinger, 2007). Researchers are constantly trying to understand where these emissions come from, as once they can locate the source, they can create new technologies and practices for mitigation potential. The carbon navigator is an online decision support system that can aid farmers in evaluating their present greenhouse gas mitigation practices, and advise methods in order to improve (Murphy, Crosson et al. 2013).
The Carbon Navigator has been designed to encourage the uptake of carbon-efficient farming ((Murphy, Crosson et al. 2013). It is a tool that has been designed through the collaboration of Bord Bia (The Irish Food Board) and Teagasc (The Agriculture and Food Development Authority). Teagasc and Bord Bia have worked together in the past, using old models of GHG emissions from Beef (Foley, Crosson et al. 2011) and dairy (O’Brien, Shalloo et al. 2011), to develop whole-farm system carbon audit programmes (Murphy, Crosson et al. 2013).
(Crosson, Shalloo et al. 2011) tells of how the methods in which the Intergovernmental Panel on Climate Change (IPCC) use to collect its data on greenhouse gas emissions on farms is not without its limitations. Therefore, a whole-farm modelling approach is widely adopted (Murphy et al, 2013). Again, (Crosson, Shalloo et al. 2011) states that although the findings by the IPCC will continue to be main source for reporting national emissions, this whole-farm modelling system is still widely accepted (Murphy, Crosson et al. 2013).
It is important to note, when discussing ways in which Ireland can reduce its GHG emissions from agriculture, simply cutting down on production is not a solution. This is due to the fact that the Earth’s population is rising, and therefore, so is the demand for food. Hence, if Ireland was to reduce its production, then food production would increase elsewhere, meaning the global GHG emissions would remain unchanged over all (Schulte, Lanigan et al. 2011). Also, if Europe was to reduce GHG emissions by restricting the amount of permanent grasslands converted to arable land, we would see a reduction of around 1.6% (Van Zeijts, Overmars et al. 2011), yet also a loss in production of goods, which would then be supplemented with imported goods, concluding in no overall, worldwide reduction in GHG emissions (Westhoek, Van Zeijts et al. 2014).
(Schulte and Donnellan 2012) focuses on three classifications of mitigation measure;
- Measures based on efficiency improvements
- Measures based on land-use change
- Measures based on technology involvement
Research has been able to identify areas of possible mitigation options for Irish agriculture. Next, we need to focus on how we can implement these options (Murphy, Crosson et al. 2013). In order to control GHG emissions from livestock production enterprises, the farmer will need to either (a) be given financial incentive by the government in return for support and implementation of necessary changes; or (b) be shown how there is a chance for the farmer to increase profitability by implementing these changes (Lovett, Shalloo et al. 2006) and (EU-Commission 2005). This is a very important fact to note- if we want our new emissions reducing technologies to be implemented well, we need the support of the farmers, and therefore, they need support as well, in forms of grant schemes and other incentives. With these incentives, farmers will then want to know the scientific basis behind emissions reduction and how they can implement change on their farm. This is where the Carbon Navigator becomes necessary.
How the Carbon Navigator works
Bord Bia has established a comprehensive data collection process, acquired access to national databases like the Irish Cattle Breeding Federation (ICBF) and the Animal Identification and Movement System (AIM), and created an IT infrastructure that can support these schemes (Murphy, Crosson et al. 2013). These scheme require auditors to visit each farm on a regular basis (no more than 18 month intervals), to gather information concerning these schemes. Here, they also now collect information for the Carbon Navigator. The information collected is then processed through the online databases acquired by Bord Bia, to determine the performance of each farmer.
The farmer can then access the Carbon Navigator system online, with help from their adviser. Here, they will see a detailed outline of their current performance and also where they can potentially improve their performance, and what the outcomes will be for these improvements. These figures are illustrated through graphical and numerical forms. Ultimately, the Carbon Navigator shows the farmer emission mitigation potential and also financial profitability potential.
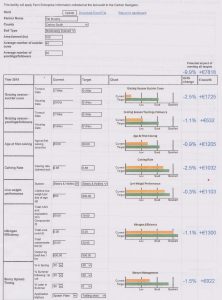
Figure 1: An example of a Carbon Navigator output screen. The information seen is what a farmer will use to implement change. The metrics used are kg CO2e/kg beef live weight and kg CO2e/kg milk solids (fats and proteins). The information here was gathered by attending a Carbon Navigator Training Day at Teagasc, in June 2016.
The choice of measures to be implemented in the Carbon Navigator is established through a string of criteria (Murphy, Crosson et al. 2013). These include:
- Measures lead to scientifically verifiable decreases in greenhouse gas emission intensities
- Measures that reduce emissions nationally and are capable of being incorporated in to current IPCC-based national inventory accounting were given high value
- Measures that are capable of being implemented by farmers without any difficulty
- Measures that are capable of enhancing profitability for the farmers
- Measures that are similar with current enterprise knowledge transfer priorities
- Measures need to be quantifiable in regards to the level of practice adoption and the effect of the adoption on greenhouse gas emissions
At this stage, the Carbon Navigator has two designs, the Dairy (D) Carbon Navigator and the Beef (B) Carbon Navigator. The navigator highlights certain technologies to mitigate GHG emissions at farm level. These include:
- Increased Economic Breeding Index (EBI) (D)
- Longer grazing season (B & D)
- Improved nitrogen use efficiency (B & D)
- Improved slurry management (B & D)
- Energy efficiency (D)
- Calving rate (B)
- Improved Live-weight performance (B)
- Age at first calving (B)
Economic Breeding Index
If you increase genetic merit by means of EBI, you have a chance of reducing GHG emission intensities through four practices (O’Brien, Shalloo et al. 2011). These include:
- Increasing milk yield – by improving milk yield and composition, production becomes more efficient, and thus, emissions per unit of product are reduced
- Improving survival and health- by reducing the number of deaths and rates of disease, production levels rise and replacement rates lower
- Improving fertility- this can lead to shorter calving intervals and lower replacement rates, which would then reduce enteric methane (CH4) emissions per unit of product
- Earlier calving- can add more grazed grass to a diet, which is of better quality to a diet than silage fed, and therefore can lower culling and replacement rates
How can you increase EBI on your farm? It is important to identify the key characteristics needed to improve milk production and fertility. Fertility can be the main weakness in a herd, and improving this will help production efficiency. Choosing a high EBI bull is vital. Breed heifers with these high EBI bulls in order to improve the herd, and increase profitability.
Grazing Season Length
There are many benefits to extending the grazing season. Firstly, the grass based diet is more digestible to the animal than that of a silage based diet. This results in increased productivity, in addition to a reduction in methane (CH4) emissions in the form of dietary energy. Another way in which to reduce CH4 emissions is by minimising the spread of slurry. When cattle can be grazed on grass for longer, then this reduces the housing season, and thus, reduces the amount of slurry build up. This reduces methane and nitrous oxide (N20) levels. Finally, through a longer grazing season, reductions in fuel emissions are possible. This is due to the fact that there would then be a lower requirement for food harvesting, as well as a lower requirement for inorganic fertilizers.
Nitrogen Use Efficiency and Slurry Management
Nitrous oxide (N20) is 300 times more lethal than CO2 in terms of its global warming potential. Therefore, it is vitally important to try and reduce the amount of N2O that enters the atmosphere. However, N20 enters the atmosphere after it fails to be taken up by plants. When a plant does not utilize its fertilizer (organic and chemical), then the left over nitrogen is released to the atmosphere. Only about 24% of Nitrogen put on land is actually used (Lalor and Lanigan 2010). Therefore, it is important to use methods of fertilizer application in which will generate the most N uptake by plants.
One of the key methods here is slurry management. Slurry should not be applied on hot sunny summer days. This would result in quick uptake of ammonia from the atmosphere. Therefore, it is important to know the correct time to apply fertilizer in order to ensure optimal uptake by plants. Spring application is advised. When applied in the spring, the weather conditions are more damp and misty, which reduces ammonia emissions. Farmers are advised to apply slurry in the evenings if they think the day is too sunny. Finally, when considering slurry application, the spreader itself is an important factor. It is proposed that a slurry spreader should release the slurry to the soil from a low height. This means keeping the appliance low to the ground, in order to ensure accurate spread, which would therefore minimize run-off and atmospheric uptake. An example of this would be a trailing shoe. It is also important to note that due to earlier spreading, storage losses of methane are reduced.
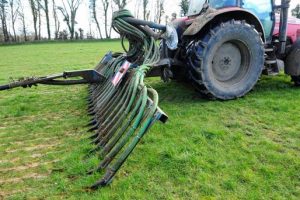
Figure 2: A trailing shoe. Slurry that is applied through this technique is more cost effective than slurry applied through the splash-plate technique, due to the fact that less slurry is wasted. Photo is by Robert Jones, the Irish Independent. Published 17/06/2015
Energy Efficiency
The use of energy on a farm is not the major source of emissions on a farm, however it has an incredible opportunity for reductions. Teagasc discovered that electricity consumption on a farm can vary from 53-108 W/I produced and cost from as low as 0.23 to as high as 0.76 cent per litre produced (Murphy, Crosson et al. 2013). These variables are quite significant. There are three main areas in which to reduce energy costs and emissions. The first is using a Plate Heat Exchanger for effective pre-cooling. The next is Variable Speed Drive (VSD) Vacuum Pumps, and the final one is Energy efficient water heating systems.
Calving Rate
Cows are expected to produce offspring once a year. The average calving rate on an Irish farm is 0.84 calves per cow, per annum (Murphy, Crosson et al. 2013). Suckler farming is seen as having a high environmental overhead, with 70-80 kg methane per year (Murphy, Crosson et al. 2013). Therefore, having an increase in calving rates will reduce emissions. For example, consider the GHG emissions produced per 100 cows per year, and that this results in only 84 calves per year. Now consider the same amount of GHG emissions produced by 100 cows per year, yet the calving rate has increased to more than 84 calves per year. It is clear that increasing calving rate is beneficial to the farms efficiency.
Improved live-weight performance
(Casey and Holden 2006) discussed how improving live-weight performance in beef cattle is significant in the reduction of emissions per kilogram of beef produced. If you can improve the live-weight performance of an animal, then there will be a shorter lifetime to slaughter, which would then result in lower emissions.
Age at first calving
The current average age of a replacement heifer for first-calving is 30 months. However, the top 10% of heifers in Ireland can produce an offspring after 26 months (Murphy, Crosson et al. 2013). Again, if we can reduce the time period from birth to first-calving, then GHG emissions would be reduced as well, as the extra months result in extra GHG emissions, at 0.01% kg beef carcass for every day that first-calving is more than 24 months where the baseline replacement rate is 20% (Foley, Crosson et al. 2011). The financial outcome is roughly €1.65 per day per suckler cow (ICBF, 2012).
Conclusion
Irish agriculture is facing a tough objective; to produce more products, while at the same time, reduce GHG emissions. International requirements will see Ireland need to become more carbon efficient, which will be difficult as the Irish agricultural sector is led by ruminant agriculture, whose emissions are high (Murphy, Crosson et al. 2013). It is vital that the uptake of mitigation techniques at farm level be taken seriously, through policies that encourage knowledge transfer (KT), through advancements of successful knowledge transfer decision support systems, and finally through making sure adequate resources are available to farmers (Murphy, Crosson et al. 2013).
Currently, researches are investigating whether the use of sexed semen could increase the profitability of dairy farms. This technique has the ability to drastically reduce the carbon footprint of both dairy and beef farming, by means of reducing the amount of dairy bull calves born, while increasing the number of beef progeny that are more carbon efficient thanks to faster growth rates and higher output. This new technology could aid in solving Irelands emissions v production dilemma.
References:
Casey, J. and N. Holden (2006). “Quantification of GHG emissions from sucker-beef production in Ireland.” Agricultural Systems 90(1): 79-98.
Crosson, P., et al. (2011). “A review of whole farm systems models of greenhouse gas emissions from beef and dairy cattle production systems.” Animal Feed Science and Technology 166: 29-45.
EU-Commission (2005). “Agri-environment Measures-Overview on General Principles.” Types of Measures, and Application (EAFRD).
Foley, P., et al. (2011). “Whole-farm systems modelling of greenhouse gas emissions from pastoral suckler beef cow production systems.” Agriculture, ecosystems & environment 142(3): 222-230.
Lalor, S. and G. Lanigan (2010). “The effect of application timing on ammonia emissions from cattle slurry in Ireland.” Advances in Animal Biosciences 1(01): 72-72.
Lovett, D., et al. (2006). “A systems approach to quantify greenhouse gas fluxes from pastoral dairy production as affected by management regime.” Agricultural Systems 88(2): 156-179.
Murphy, P., et al. (2013). “The Carbon Navigator: a decision support tool to reduce greenhouse gas emissions from livestock production systems.” animal 7(s2): 427-436.
O’Brien, D., et al. (2011). “The effect of methodology on estimates of greenhouse gas emissions from grass-based dairy systems.” Agriculture, ecosystems & environment 141(1): 39-48.
Schulte, R. and T. Donnellan (2012). “A marginal abatement cost curve for Irish agriculture.” Teagasc submission to the National Climate Policy Development Consultation, Teagasc, Oakpark, Carlow, Ireland.
Schulte, R., et al. (2011). “Irish agriculture, greenhouse gas emissions, and climate change: Opportunities, obstacles, and proposed solutions.” Oak Park, Carlow, Ireland: Irish Agriculture and Food Development Authority.
Van Zeijts, H., et al. (2011). “Greening the Common Agricultural Policy: impacts on farmland biodiversity on an EU scale.” PBL Netherlands Environmental Assessment Agency, The Hague.
Westhoek, H., et al. (2014). “Greening the CAP.” An analysis of the effects of the European Commission’s proposals for the Common Agricultural Policy 2020.