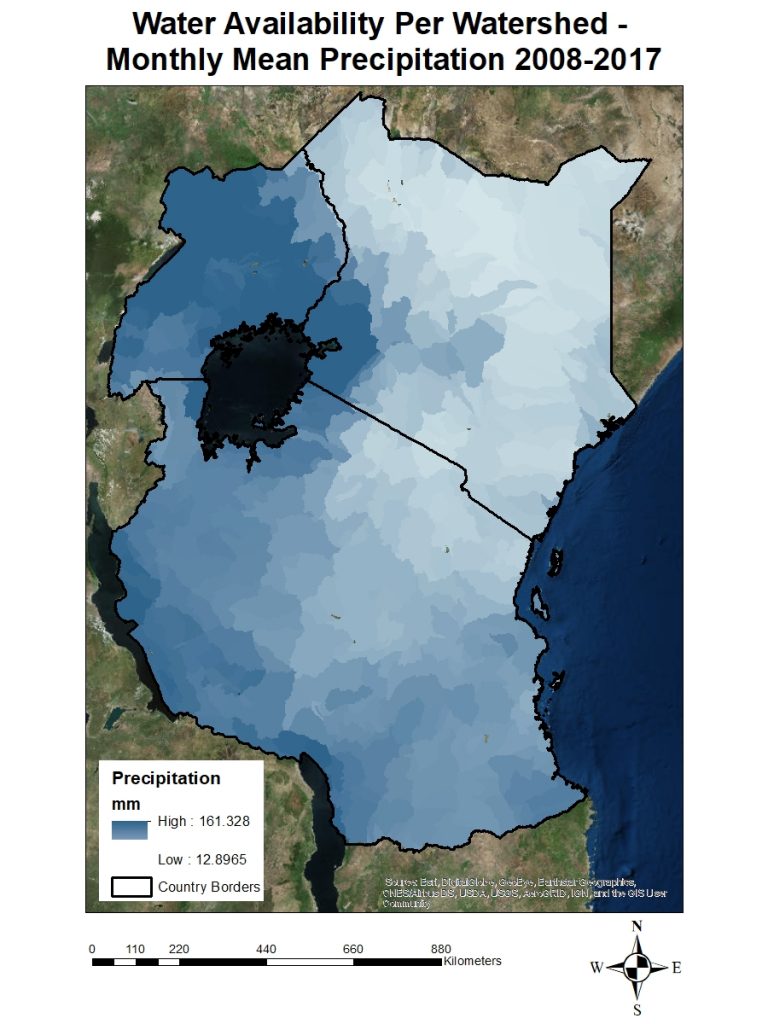
The water availability layer for Tanzania, Kenya and Uganda has been produced. This output shows a total time frame precipitation average for the years 2008 to 2017, and the sum of the monthly average per watershed. The blue represents high water availability and it is an indication that water availability may not limit the adoption of feeds and forage which require water or soil moisture. However, the light blue to white areas show areas where water availability may limit the adoption of feed interventions which require water or high soil moisture.
MSc in Climate Change, Agriculture and Food Security