Forest Climatic Zones
Once the data from both frost days and precipitation patterns was completed forest climatic zones could be created by combing the data from both attributes. This was done by choosing stations which had both frost days and precipitation data for the period 1997-2017.
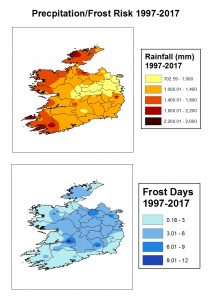
We combined the data by sorting both frost days and precipitation from low to high where Low frost risk was ≤ 4 frost days, medium frost risk 4.01-8 and a high frost risk was ≥ 8.01. A similar method was used for precipitation where low precipitation is ≤ 1,000 mm of rainfall, medium precipitation is 1,000.01-1,800 mm and high precipitation is 1,800.01 + mm of rainfall. After both were combined different zones emerged and it was these zones which were to be used to create a forest climatic zone map through GIS.
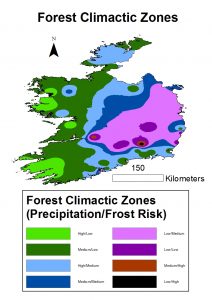
Once the map was created 8 different climatic zones were identified and colour coded to show the distinct zones across Ireland. Below is the final Forest Climatic Zone map. The different colours represent the various zones where the most suitable zones are the areas with the highest rainfall amounts recorded (High) and where frost risk is at the lowest (Low). For example the most suitable location is the High/Low areas highlighted with a light green colour and the least suitable location is the Low/High which is shown using a black colour. Overall, it was found that many places across Ireland are very suitable for Sitka spruce establishment.