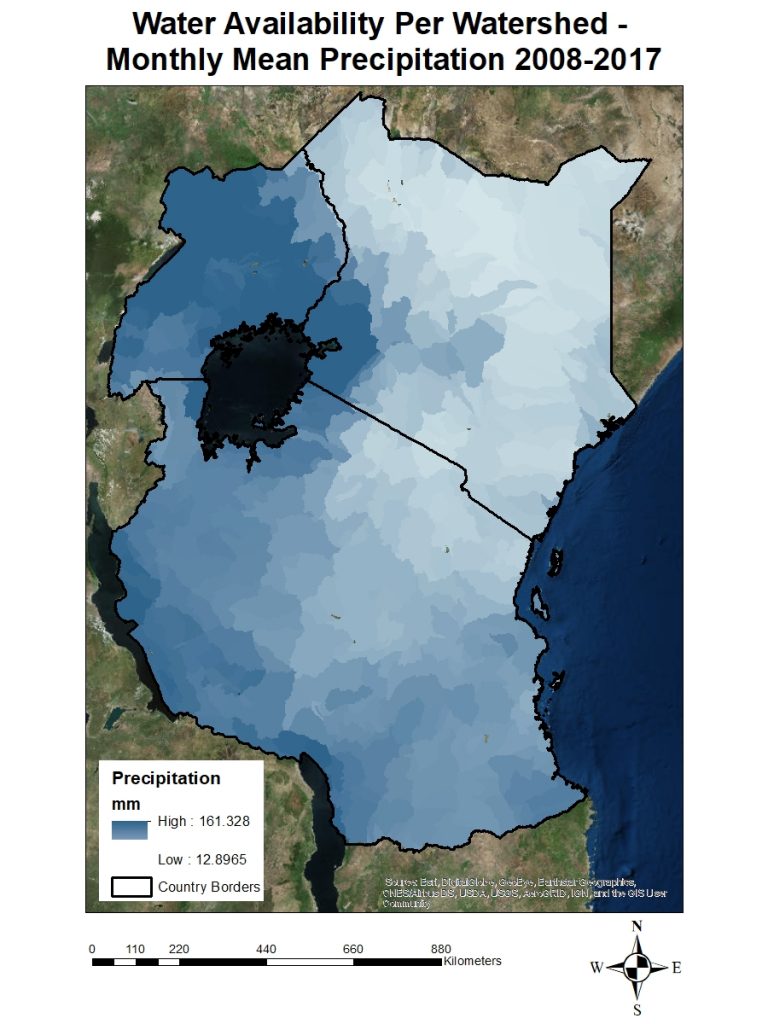
The water availability layer for Tanzania, Kenya and Uganda has been produced. This output shows a total time frame precipitation average for the years 2008 to 2017, and the sum of the monthly average per watershed. The blue represents high water availability and it is an indication that water availability may not limit the adoption of feeds and forage which require water or soil moisture. However, the light blue to white areas show areas where water availability may limit the adoption of feed interventions which require water or high soil moisture.
Land availability layer is ready!
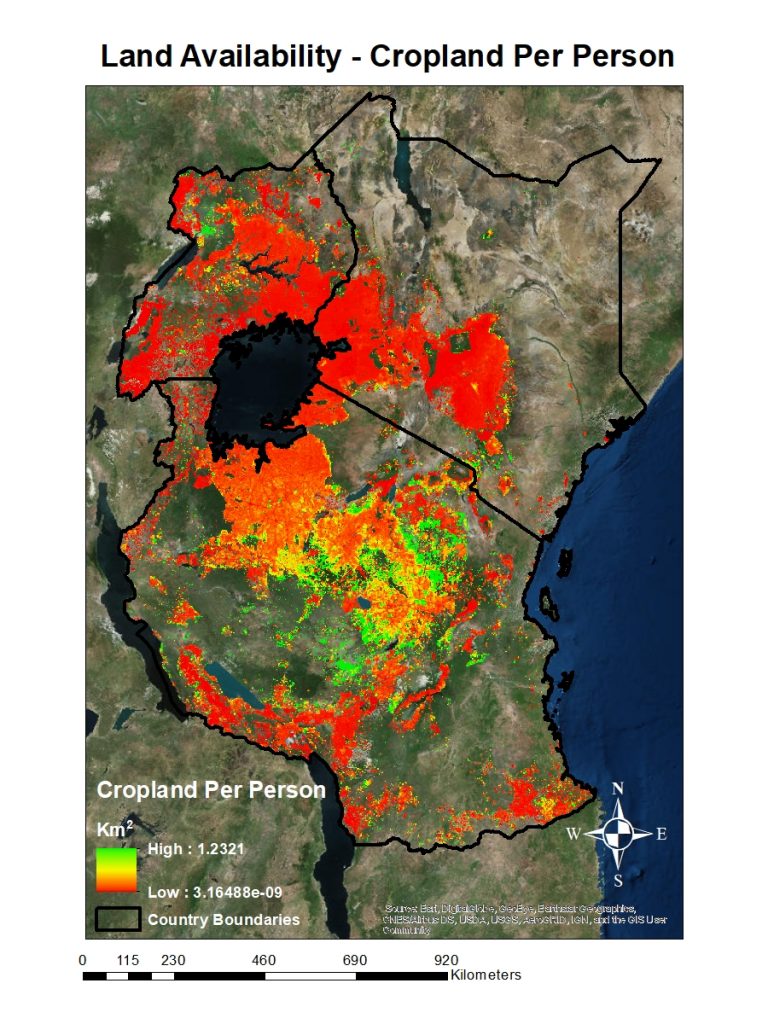
The land availability layer has been produced. I thought it is important to share that this study was conducted using ESRI ArcGIS 10.4 (ESRI, Redlands, CA) and R software (R Core Team, 2017) and variables were mapped at a spatial resolution of 1 kilometre. This map shows available land for feeds and forage production in Kenya, Tanzania and Uganda. The red represent areas with no or less land available for feeds and forage production. Therefore, farmers in these areas are less likely to adopt feed interventions which require the use of more land.The green represent areas with available land for forage production and further implies that farmers in these areas are most likely to find feed options which require land attractive.
Data used to produce maps/layers.
After settling on the proxy indicators presented on the previous mapping update, I looked for organisations which were in position to provide the proxy indicator's data. The purpose of this post is to share the sources which provided the data used to produce the four layers or maps.
Four maps
- Feed quantity
- Seasonal feed scarcity
- Land availability
- Water availability
In this study, feed quantity was defined as the available feed quantity per animal. Seasonal feed scarcity was defined as the number of months with feed quantity less than the requirements of one tropical livestock unit (TLU). Therefore, the following sources provided data which was used to produce the feed quantity and Seasonal feed scarcity maps:
• Copernicus Global Land Services provided Net Primary Productivity (Dry Matter Productivity) data from 2008 to 2010 and Land cover data from 2015 to 2016.
• International Livestock Research Institute (ILRI) Datasets Portal provided livestock production systems which was used to extract the mixed farming system data of East Africa.
• Food and Agriculture Organization (FAO) provided a pasture density layer which was used to calculate the fraction of dry matter production used as livestock feed.
• Food and Agricultural Organization (FAO) provided Global Cattle Density data which was used to determine annual feed production per animal.
Land availability was defined as the cropland area available per person. The following sources provided data which was used to produce the land availability layer:
• Worldpop provided population density data.
• International Institute for Applied System Analysis (IIASA) provided crop area data.
Water availability was defined as the amount of rainfall and inflow accumulation in a given area.The following sources provided data which was used to produce the water availability layer:
• National Oceanic and Atmospheric Administration (NOAA) was provided rainfall distribution maps from 2008 to 2017.Thereafter, data for deriving flow accumulation was acquired from (Lehner et al., 2008)
Time to head back to Ireland
My time in Nairobi has come to an end. I would like to take this opportunity to thank everyone who contributed to the success of my research work. It was such a great experience working with people from different disciplines and vast walks of life. It is mind-blowing that even if their disciplines and backgrounds are diverse, they are all working towards achieving one goal which is promoting sustainable livelihoods. It was really an honour working with my colleagues from ILRI and CIAT.A special thanks to Dr. Alan Duncan, Dr. Philip Thornton, Dr. Chris Jones and Dr. Todd Crane for their guidance.

Limitations to livestock productivity in mixed farming systems
Seasonal feed scarcity and feed quantity
Ideally, forage production should match livestock feed requirements all year round for optimum livestock productivity. However, seasonal shortages of feed has been identified as a major constraint to livestock productivity (Smith, 2002) (Abate et al., 1993) .
The rainy season and the warm season are associated with high biomass production which influences high feed availability and improved livestock productivity (Leonard, 2015). The dry season and the cool season are associated with low biomass production, which lead to high feed scarcity and deceased livestock productivity as the available feed fail to meet livestock nutrition requirements (Lukuyu et al., 2009). The resulting livestock nutrition stress negatively impacts smallholder farmers livelihoods as milk and other livestock products sales decline due to low productivity.
The feed scarcity problem is worsened by lack of farmers’ knowledge on locally available feed interventions which can be adopted to increase or maintain productivity during the dry season or cool season (Lukuyu et al., 2011). Feed scarcity can be addressed through targeting feed option which can close the feed gap during the dry or cool season. For instance, hay-making and silage-making are attractive options which can be adopted in seasons characterized by high biomass production to close the feed gap in seasons with low biomass production (Simbaya, 2002).
Feed quality
The important feed resources for the mixed farming systems are crop residue and natural pastures. However, these feed resources are often characterized by a low nutritive value or quality in the dry season (Simbaya, 2002). Therefore, poor quality feed falls amongst the major constraints of livestock productivity. Crop residues are associated with high fiber and low protein, which fail to support optimal microbial growth and match livestock nutrition requirements for increased productivity (Ball et al., 2001). This is an indication that farmers need of other feed options and interventions which will increase the feeding value of crop residues (Reed and Goe, 1989).
Various studies (Wanapat et al., 2009) (Sarnklong et al., 2010) (Roothaert and Paterson, 1997) have reported on interventions which can be adopted to improve the quality of feed . These interventions include chemical treatment of crop residues using urea, supplementing feed with energy-rich supplements such as molasses, supplementation of feed using protein by-products such as blood and bone and legume leaf meal and the use of fodder trees and shrubs. These feed options improve the nutritive value of feed by increasing digestibility, palatability and crude protein content (Israel and Pearson, 2000).
Proxy indicators of feed constraints and adoption factors
On the "Mapping of feed constraints and adoption factors" post, I mentioned that I will share the proxy indicators used to map the constraints and factors. The indicators are as follows:
Feed Constraints
Feed quantity
- Net Primary productivity/Dry Matter Productivity
- Land cover
- Cattle density
Seasonal feed scarcity
- Number of months per year where dry matter production is below the requirements of a tropical livestock unit (TLU)
Adoption factors
Land Availability
- Population density
- Crop area
Water Availability
- Rainfall distribution
- Flow accumulation
Factors contributing to the adoption of feed interventions
The rate of adoption for feed options depends on the potential of the feed options to solve or deal with the core feed constraints which farmers are faced with. For instance, in areas where feed quantity constrains livestock productivity, adoption of feed options such as legumes is likely to be low as legumes deal well with feed quality constraints but do not provide enough herbage to secure high feed quantity. Additionally, in areas where seasonal scarcity limits livestock productivity, adoption of legumes is most likely to fail as legumes provide feed during the growing season, thereby leaving a feed gap after the growing season.
Limitations to livestock productivity in mixed farming systems

Something interesting
I have been working on finding the proxy indicators of the feed constraints and adoption factors I will be mapping. I must say, it has been quite interesting learning the things one has to consider before the actual production of maps. On my next post I will be sharing the proxy indicators I have settled on.
Effects of climate change on mixed farming systems
Predicted changes in rainfall distribution and temperature will have a substantial impact on crop and livestock productivity as they will affect the length of the crop growing season, crop growth, potential crop yield, soil-water availability (Porter and Semenov, 2005), livestock health and nutrition (Thornton et al., 2007). These climatic variabilities are expected to shift ranges of crop suitability, weeds, insects, and crop and livestock diseases. This will negatively affect livestock feed production and food availability, accessibility, utilization and stability (Kotir, 2011). However, parts of the tropical highlands where cool temperatures constrain crop growth will benefit from the rising temperatures as they likely enhance crop growth (Thornton and Herrero, 2014).