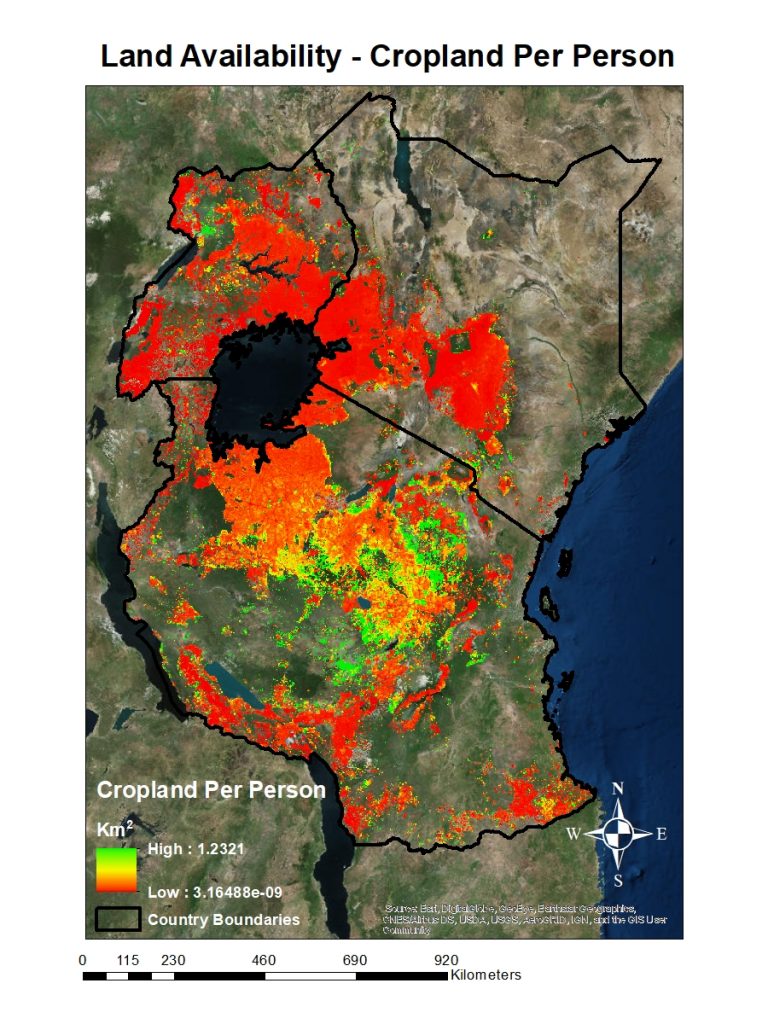
The land availability layer has been produced. I thought it is important to share that this study was conducted using ESRI ArcGIS 10.4 (ESRI, Redlands, CA) and R software (R Core Team, 2017) and variables were mapped at a spatial resolution of 1 kilometre. This map shows available land for feeds and forage production in Kenya, Tanzania and Uganda. The red represent areas with no or less land available for feeds and forage production. Therefore, farmers in these areas are less likely to adopt feed interventions which require the use of more land.The green represent areas with available land for forage production and further implies that farmers in these areas are most likely to find feed options which require land attractive.