Here you will find charts and graphs of the data gathered from our Twitter campaign for Climate Security. Our main focus in this campaign was to drive users to the Climate Security website. Keeping this in mind we analysed drivers of high URL clicks per Twitter post to visualise the components of a successful tweet in terms of URL clicks and engagement.
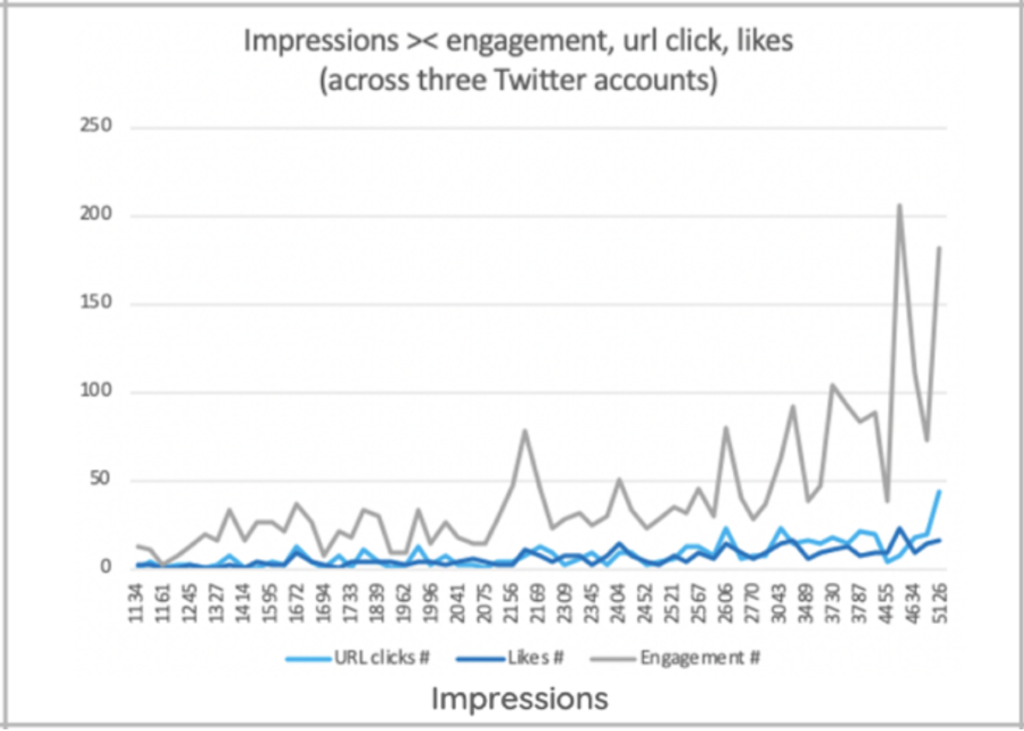
Correlation between impressions and engagement on URL clicks and likes.
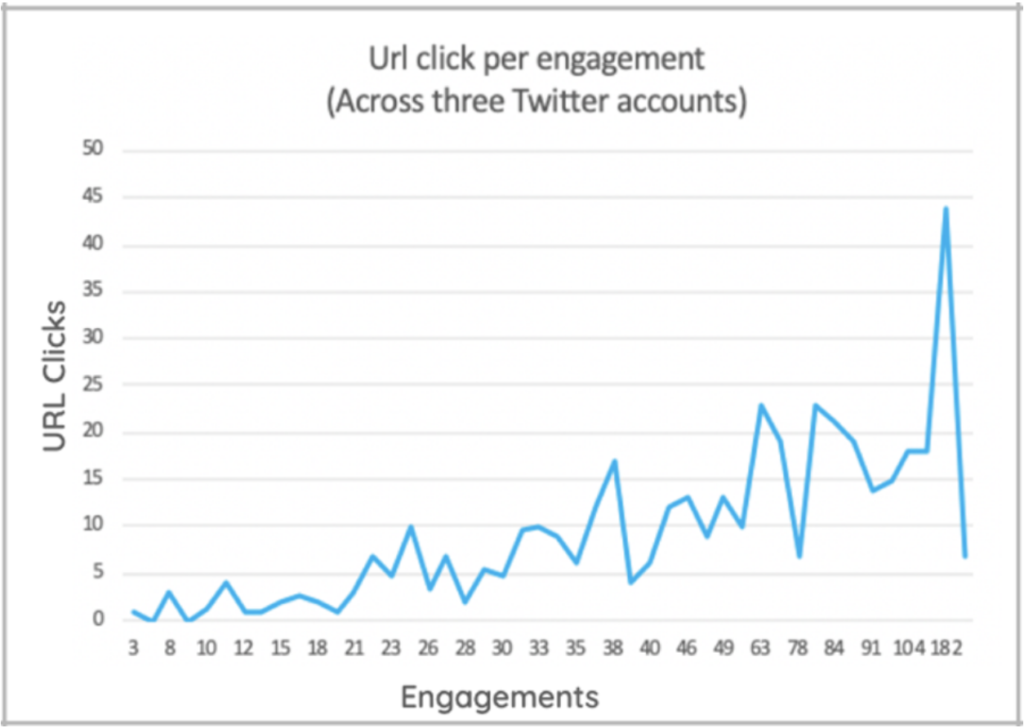
How does high engagement affect URL clicks per tweet?
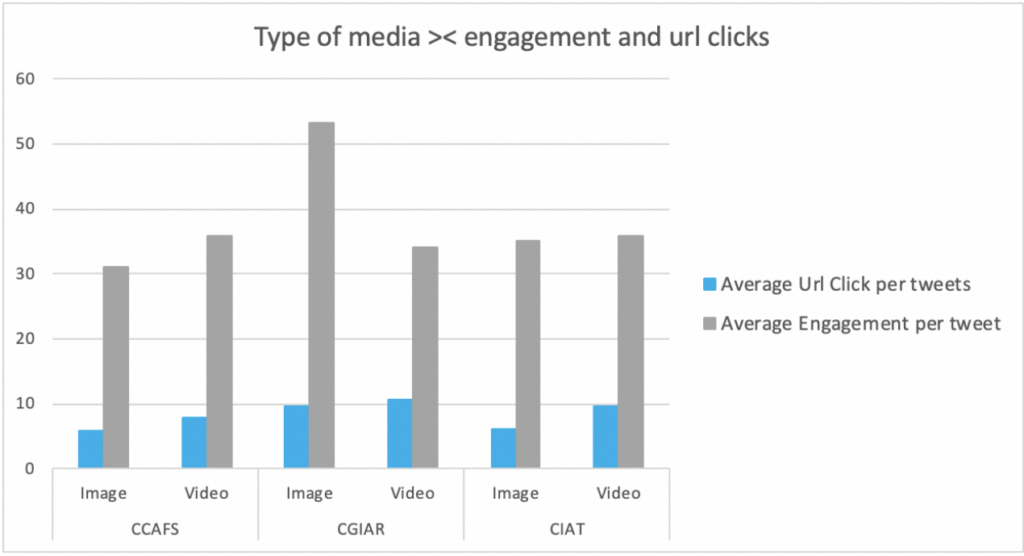
Influence of media type on tweet engagement/URL clicks.
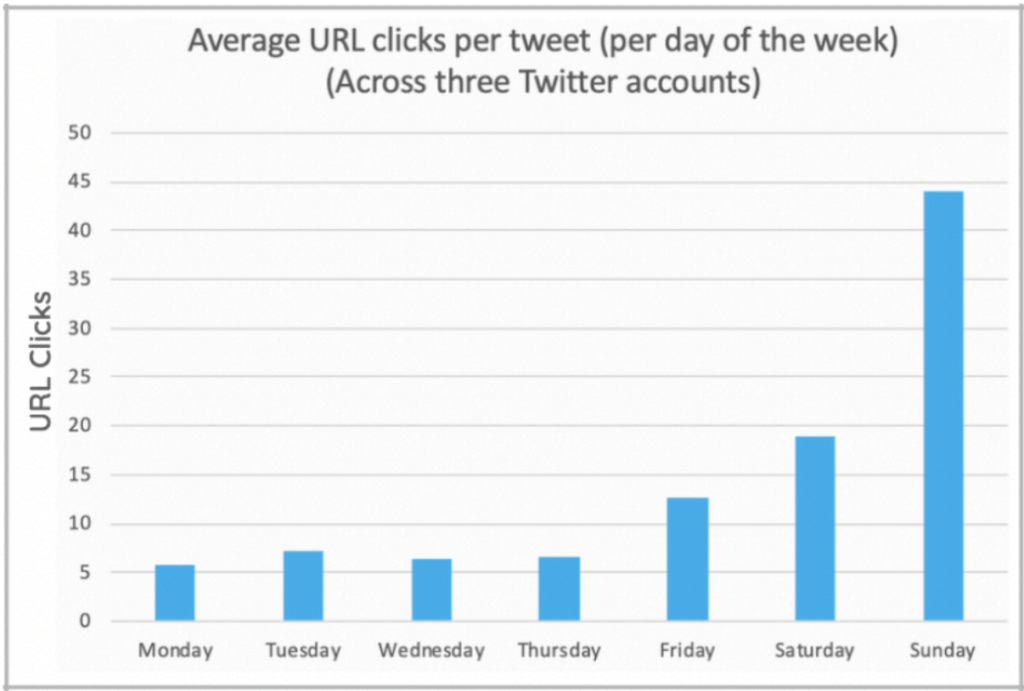
Influence of day of the week on URL clicks.
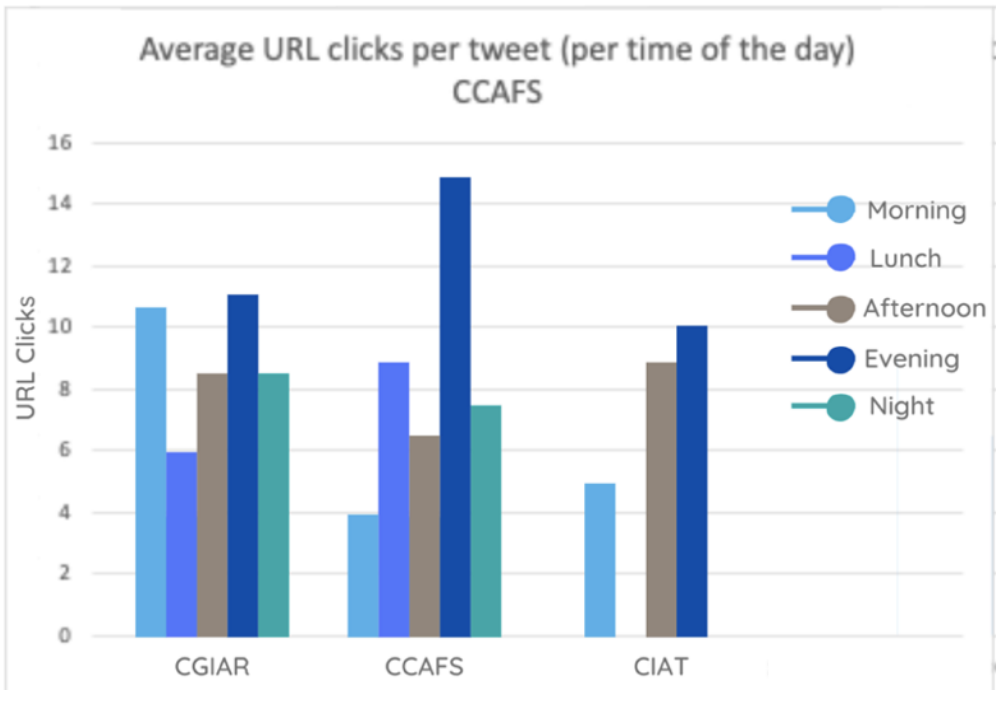
Influence of time of day on URL clicks.