Communications Intern for CGIAR Climate Security Initiative.
Google Analytics visualisation.
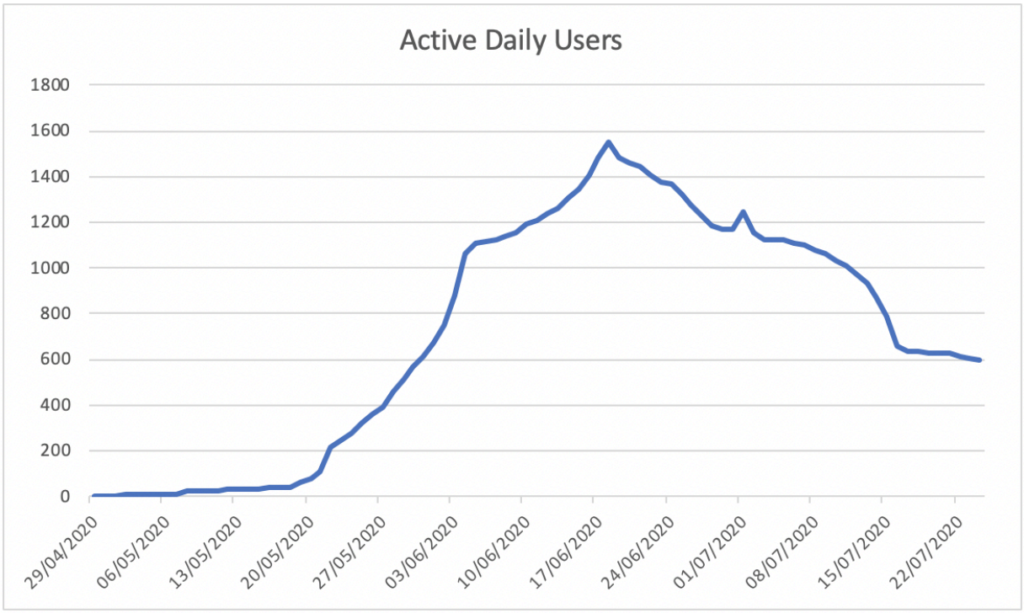
Daily active users of the Climate Security website.
The graph above displays the total number of daily active users to the Climate Security website. Daily active users reached its peak at approx. 1500 users on 18/06/2020. There was a common theme found when analysing the data of users - when there was intensive social media promotion or events being held, daily active users of the site soared in comparison to times of relative inactivity among the Climate Security team.
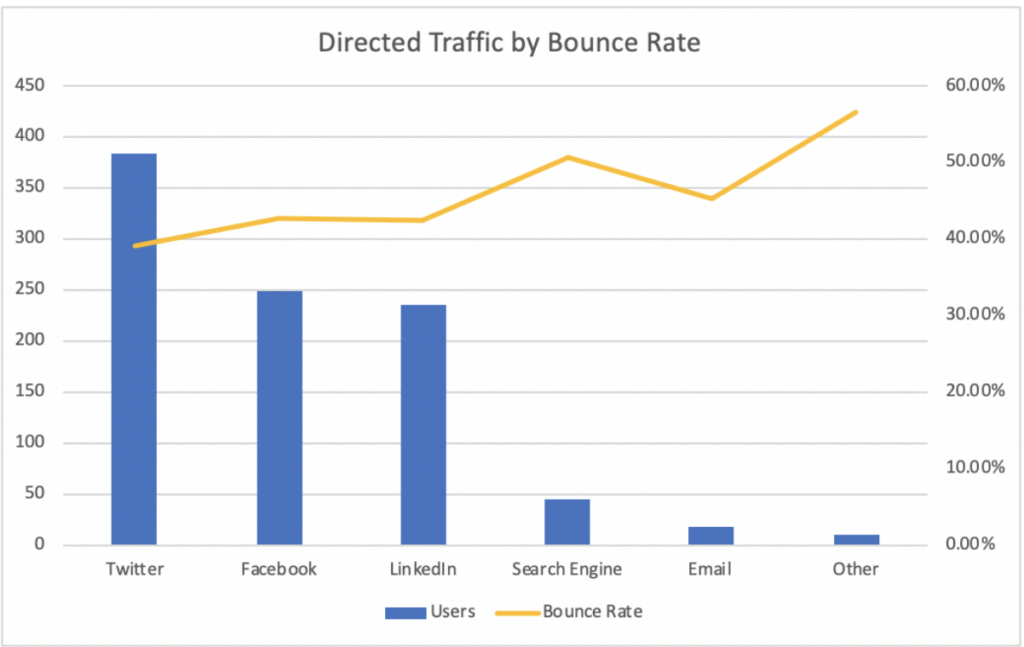
Bounce rate per navigation site on the Climate Security website.
Google Analytics gives us the opportunity to see the bounce rate of users in relation to the means in which they navigated to the site. This can indicate which navigation route is most likely to traffic users who are engaged with the content of the site. The bounce rate of a website refers to the total number of single page sessions divided by the total number of page visits whereby the user views only a single page on the website and does not explore further. A high bounce rate can indicate low engagement with the site and a ‘poor experience following the click. The above graph shows us that Twitter had the lowest bounce rate per tweet while 'other' such as email or third party sites had the highest bounce rate per tweet.
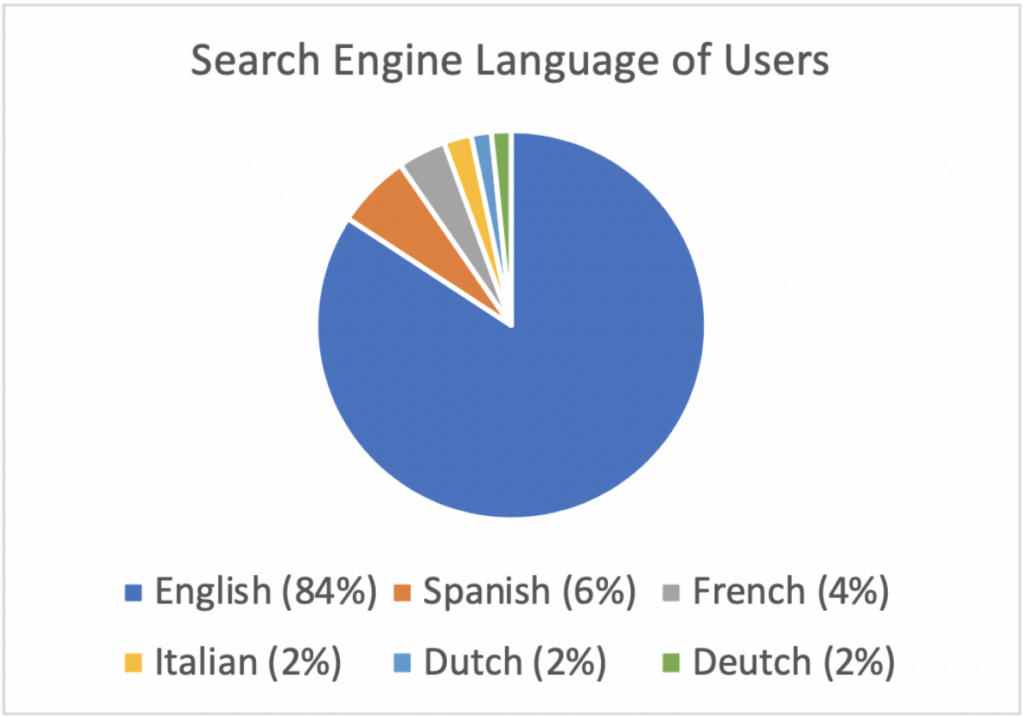
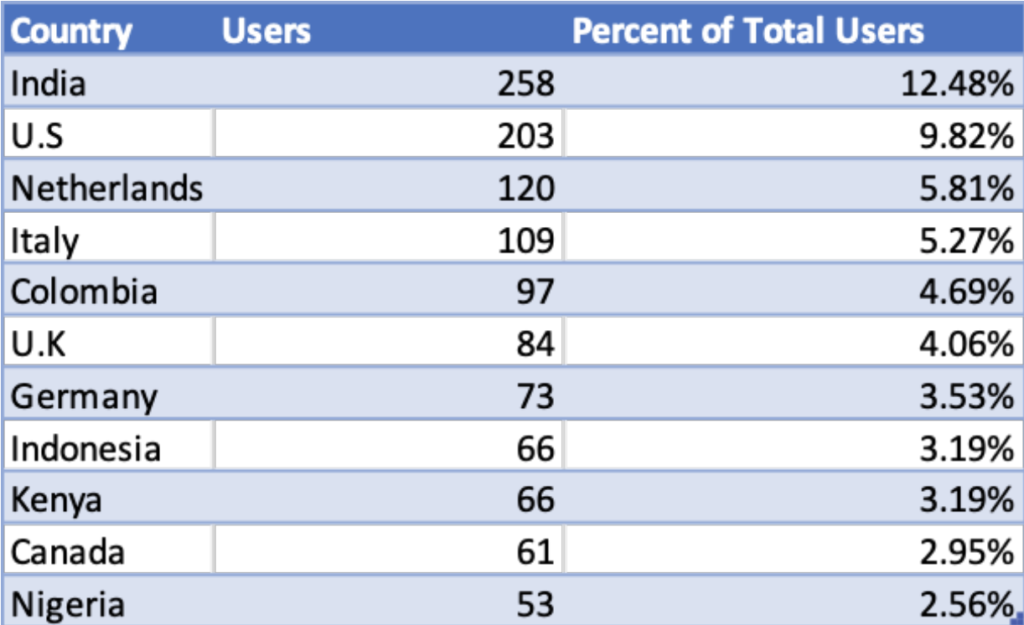
Language and Geographical data.
Using the data gathered by Google Analytics we can see the language that a user’s computer is searching in. This gives us an insight into popular first languages among our users. In conjunction with the data on language, the geographical data from Google Analytics can be used to determine where users are coming from around the world. As shown above we can see that English, at 84%, was the primary language used to search the site followed by Spanish at 6% and French at 4%. Other search languages used were Italian, Dutch and Deutsch all at 2%.The website had quite a large reach with visitors from 127 different countries. India leads with 12.48% of total users, followed by the U.S with 9.82%. The third, fourth and fifth countries with highest visitor rates were The Netherlands (Deutsch), Italy (Italian) and Spain (Spanish) respectively. This correlates with the popular search engine languages except for in India where it may be assumed users searched primarily in English.