This last month has been a particularly frustrating yet also interesting research period for me. Overall, I have spent much of my time reading relevant papers that I might use as references and also doing my data analysis. To remind you all, I am looking at Viet Nam and its state of food security from a biophysical and economic perspective.
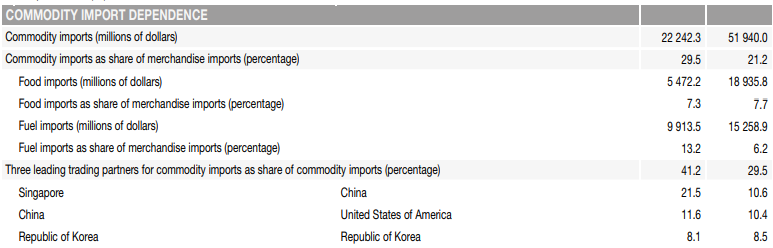
Despite being defined as a ‘Non-commodity dependent economy’ by the United Nations, Viet Nam is still a developing economy, with a lower-middle income range. It is no longer classified as a Low-Income Food-Deficit Country, having worked its way out in 2021. As food imports are only 7% of all imports, they are relatively self-sufficient, but this is only as a whole (See Import Dependency Chart below). However, as I have been looking more in-depth at this, we can see some potential areas where the country might be exposed coming out of my research. This will be talked about in future blog posts!
As I said at the beginning of this post, this last month has been such a learning curve, as I found that different data sources have conflicting information. Whether it be those import volumes of Maize into Viet Nam from Argentina differing by 10,000 Kgs or a country not being on the list of import providers, I was frustrated with the lack of consistency. Whether I compared values or volume, data from the world bank or the FAO, there seemed to be some discrepancies. However, by creating a spreadsheet compiling and comparing much of the data I was able to find a dataset that I am happy working from to begin my main analysis.
I also completed a few days of Data Validation to ensure that the data I compiled from these various sources matched up and picked the most consistent: that which is from the Vietnamese Customs Website customs.gov.vn. I was unable to embed an example page of this data but if click on the link you can see the website I used to source this data. While it is not in its raw form, and is in a PDF format, myself and my supervisors determined that it was still a valid and accurate source of import information. This is opposed to coming from websites like FAOSTAT which while very useful, are apparently not as powerful a tool when it comes to writing academic literature and carrying out studies. I believe this is the case as the data is compiled from a number of sources and ideally should be tracked and easily referenced. For this analysis I imported and converted the PDFS via the Excel tool PowerQuery to a usable format, allowing filtering by product and source region.
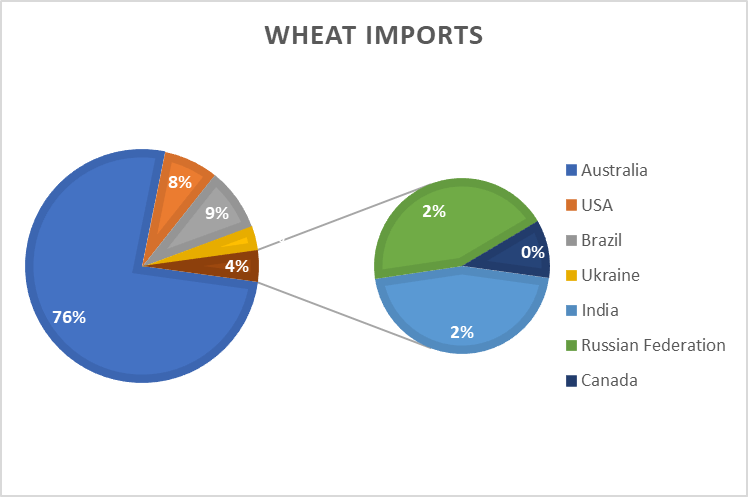
My rationale and increased analysis is thus: While the above infographic I created is useful, it only provides a small snapshot of the 2022 Wheat Imports Origins by Volume: Australia provided 76% of the imports for Vietnam that year. This could be interpreted that Australia is the top partner with Vietnam and has always been. However, when looked at over time, a more nuanced picture is seen. So, the next stop was for me to determine the change over time. In the coming weeks I want to determine the causes of the changes and possible use that to see what the potential vulnerability of VietNam to imports is. Thus, I decided that I would create a time-series analysis yearly from 2013 to 2022 from this data to see what historical changes in imports have taken place. That was so I could visually see a graphic representation of the rise and fall of commodity providers, which, as a visual learner is rather effective.
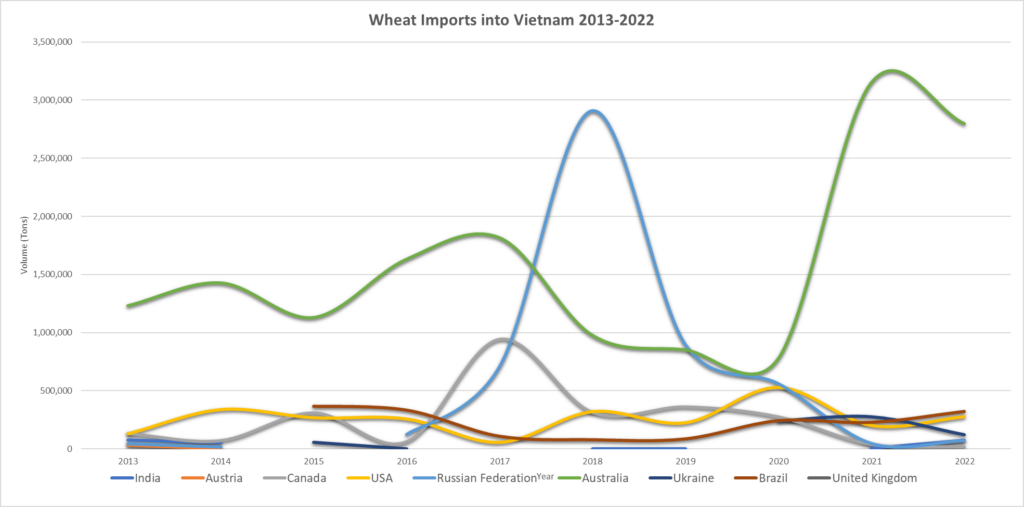
This image helps in my aim to track the vulnerability of the commodity types to shocks. The stark change, and abrupt rise and fall of the Russian Federations export volumes to Viet Nam is especially clear here, and my next aim is to include this, and the other food and feed sources in my paper.
As I conclude with this post, I leave you all with a quote from Ban Ki-Moon, addressing the importance of the different factors that influence our food systems and our lives. Just something to think about 🙂
“We must connect the dots between climate change, water scarcity, energy shortages, global health, food security and women’s empowerment. Solutions to one problem must be solutions for all”
Ban Ki-moon, Address to the 66th General Assembly: “We the Peoples”, 2011
References:
STATISTICS OF IMPORT BY COUNTRY/TERRITORY-MAIN IMPORTS December 2022. (2022). Ministry of Finance Vietnam
Laurent, A. (2021). State of Commodity Dependence 2021. United Nations. https://doi.org/https://doi.org/10.18356/9789210057790